How to use Zahara
Zahara is the AI Agent Control Plane. It governs every agent your team builds, imports, or connects -- giving you review gates before anything runs, a full trace of every decision, and audit proof that what happened can be trusted. This manual explains every main page, what each option does, why it matters, how to use it, what can go wrong, and what evidence proves the work can be trusted.
What Zahara is
Zahara gives teams one control plane for building, importing, and connecting AI agents, then governing every action they take with review gates, runtime oversight, evidence, and audit.
Why teams use it
Most agent tools can run work, but none of them govern it. Zahara wraps every agent with approval gates, run traces, cost visibility, and an audit trail so teams can move fast without losing accountability.
What users get in week one
In the first week, a team should get one agent into the control plane by building, importing, or connecting it, then review it, activate it safely, run one proof, confirm the audit trail, and start routing real work through Workboard.
Start with the job in front of you
The manual is reference material. These paths get a new operator to the right surface without reading the whole page first.
Take the control plane tour. Zahara walks you through a live sandbox agent with approvals, traces, and audit proof already running before you connect anything real.
Import a file or config, connect a running agent, or use Trace Connect to observe external runs without moving them. Review and activate only after the proof path is visible.
Open Studio and choose your mode: Thomas in Vibe for a conversational spec, Flow for visual graph wiring, or Pro for full YAML control.
Use Inspect, Trace, and Audit together so the answer is grounded in run evidence.
Open Command Center first, read what needs attention, then follow the safest next action.
Add credentials, check Gateway routing, and connect tools before asking agents to run live work.
Find the right guide
Core trust path
Build / Import / Connect -> Review -> Activate -> Run -> Inspect -> Audit
This is the control plane loop. Every agent, whether built in Studio, imported from a file, or connected from an outside runtime, moves through the same governed path before it can run real work. Nothing skips review. Nothing runs without a trace.
Workboard flow
Source -> Card -> Runner lease -> Review -> Evidence -> Done
Workboard is Zahara's shared board for work, proof, and review. Loop is optional and should only be used when another pass is worth the added cost.
Day 1 quick start
Use this to understand the control plane in under 10 minutes. One complete loop: see the operating room, understand an agent, inspect a run, confirm the proof, move work.
Start with the guided tour if you are new. Zahara walks you through a sandbox agent with approvals, traces, and evals already alive. Nothing sends, spends, or touches real systems.
This is the operating room. See what needs your attention now, what is safe to leave alone, and whether the workspace is healthy before opening any other page.
Open one agent. Check its status, how it entered the control plane, its recent run evidence, and whether it is safe to test.
Find a sample run. Read latency, cost, tokens, events, and any errors. A result is not proven until Inspect and Audit agree on the same run.
Find the matching audit events. This is the tamper-evident record. If Inspect and Audit agree, the proof is real.
Use a proof card or starter card to see how work moves from source to card, runner, review, evidence, and done.
System map
Zahara is the control plane for every agent in your workspace. Studio builds new agents with Thomas in Vibe, Flow, or Pro. Import brings in existing configs, files, or GitHub sources. Trace Connect observes agents already running in other tools. All three paths land in Fleet, where the agent is governed. Gateway controls which models agents can use and at what cost. Workboard routes real work through agents and keeps every card accountable. Approvals gate anything sensitive until a human decides. Inspect and Trace explain exactly what happened in any run. Audit records it all with tamper-evident proof.
What Zahara is not
Teams coming from agent frameworks, model APIs, or no-code tools often underestimate what Zahara does. Here is the fastest correction.
- Zahara is not just a builder. Studio has three ways to build: Thomas in Vibe for conversational specs, Flow for visual graph wiring, and Pro for full YAML control. The control plane is the product.
- Zahara is not just an importer. Import is one entry path. You can also build from scratch in Studio or connect agents already running in LangGraph, CrewAI, n8n, OpenAI, or your own stack via Trace Connect.
- Zahara is not a model host. It routes to your own model providers through Gateway. You bring the keys; Zahara governs how they are used.
- Zahara is not a replacement for your existing agent stack. It wraps what you already have with governance, review, tracing, and proof without forcing you to move or rewrite anything first.
Glossary
These are the words Zahara uses in the product. Use the role terms to understand who should act, and the platform terms to understand what each surface proves.
Roles
- Operator
- The person responsible for monitoring agents day to day and choosing the next safe action.
- Reviewer
- The person who approves, rejects, or requests changes when a run, tool, eval regression, or policy needs human judgment.
- Builder
- The person who creates, imports, configures, or edits an agent before it is trusted for real work.
- Admin
- The workspace owner or manager who controls credentials, team access, tokens, and high-impact settings.
Platform terms
- Agent
- A configured AI worker with instructions, model policy, tools, run history, and governance settings.
- Fleet
- The roster of agents in a workspace. Use it to find, review, pause, configure, or inspect one agent.
- Run
- One execution attempt by an agent. A run should have status, cost, latency, events, and audit proof.
- Runner
- The background worker that executes Workboard cards or agent tasks. If no runner is online, queued work waits.
- Runner lease
- A claim on one Workboard card by one runner so two workers do not perform the same task at once.
- AI Agent Control Plane
- The Zahara system that governs every agent in a workspace, regardless of how the agent was built or where it runs. The control plane enforces review gates, routes model access through Gateway, traces every run, and keeps a tamper-evident audit record.
- Control plane
- The Zahara system that governs agent activity across build, import, activation, runtime, and audit. When an agent enters Zahara, however it was created, the control plane owns what it is allowed to do, what gets reviewed, and what gets proved.
- Studio
- The agent builder inside the control plane. Vibe lets Thomas interview you and turn plain-language answers into a governed agent spec. Flow lets you wire the agent visually as a graph of nodes and edges. Pro gives you direct access to the full agent YAML spec. Import brings an external agent config into the builder for review before activation.
- Thomas
- Zahara's AI. Thomas runs the Vibe interview in Studio, answers questions in the platform guide, and helps operators understand what the current page shows and what to do next.
- Approval
- A human decision point that pauses risky, blocked, or policy-sensitive work before it continues.
- Trace
- The step-by-step path of a run across model calls, tools, approvals, errors, and output.
- Inspect
- The detailed run view for status, latency, cost, tokens, events, output, and error context.
- Audit
- The timestamped evidence log for imports, runs, reviews, evals, credentials, and other important state changes.
- Gateway
- The routing layer for model providers, keys, budgets, and fallback behavior.
- Workboard
- The board where proof work and business work become cards with owners, status, review, and evidence.
- Adapter
- The importer that reads a source format and maps it into Zahara fields for review.
- Slug
- A short URL-safe identifier, like support-triage, used to reference agents or config items.
- Source record
- The evidence of how an agent entered the control plane: the original file, config, or connection, plus the adapter used, hash, field mappings, and any warnings raised during review. Built agents have a spec history instead of a source record.
Trust rules
Zahara only confirms an agent is safe to run when there is real evidence. Every status, count, and run result should come from visible platform data, not estimates.
- Do not claim an agent is ready unless it has evidence.
- Do not trust imports until warnings and mappings have been reviewed.
- Do not treat a run as proven unless Inspect and Audit agree.
- Do not approve tools just because a source requested them.
- Do not let Thomas invent counts, IDs, statuses, agent names, or run details.
- If a page has live data, use the page data first.
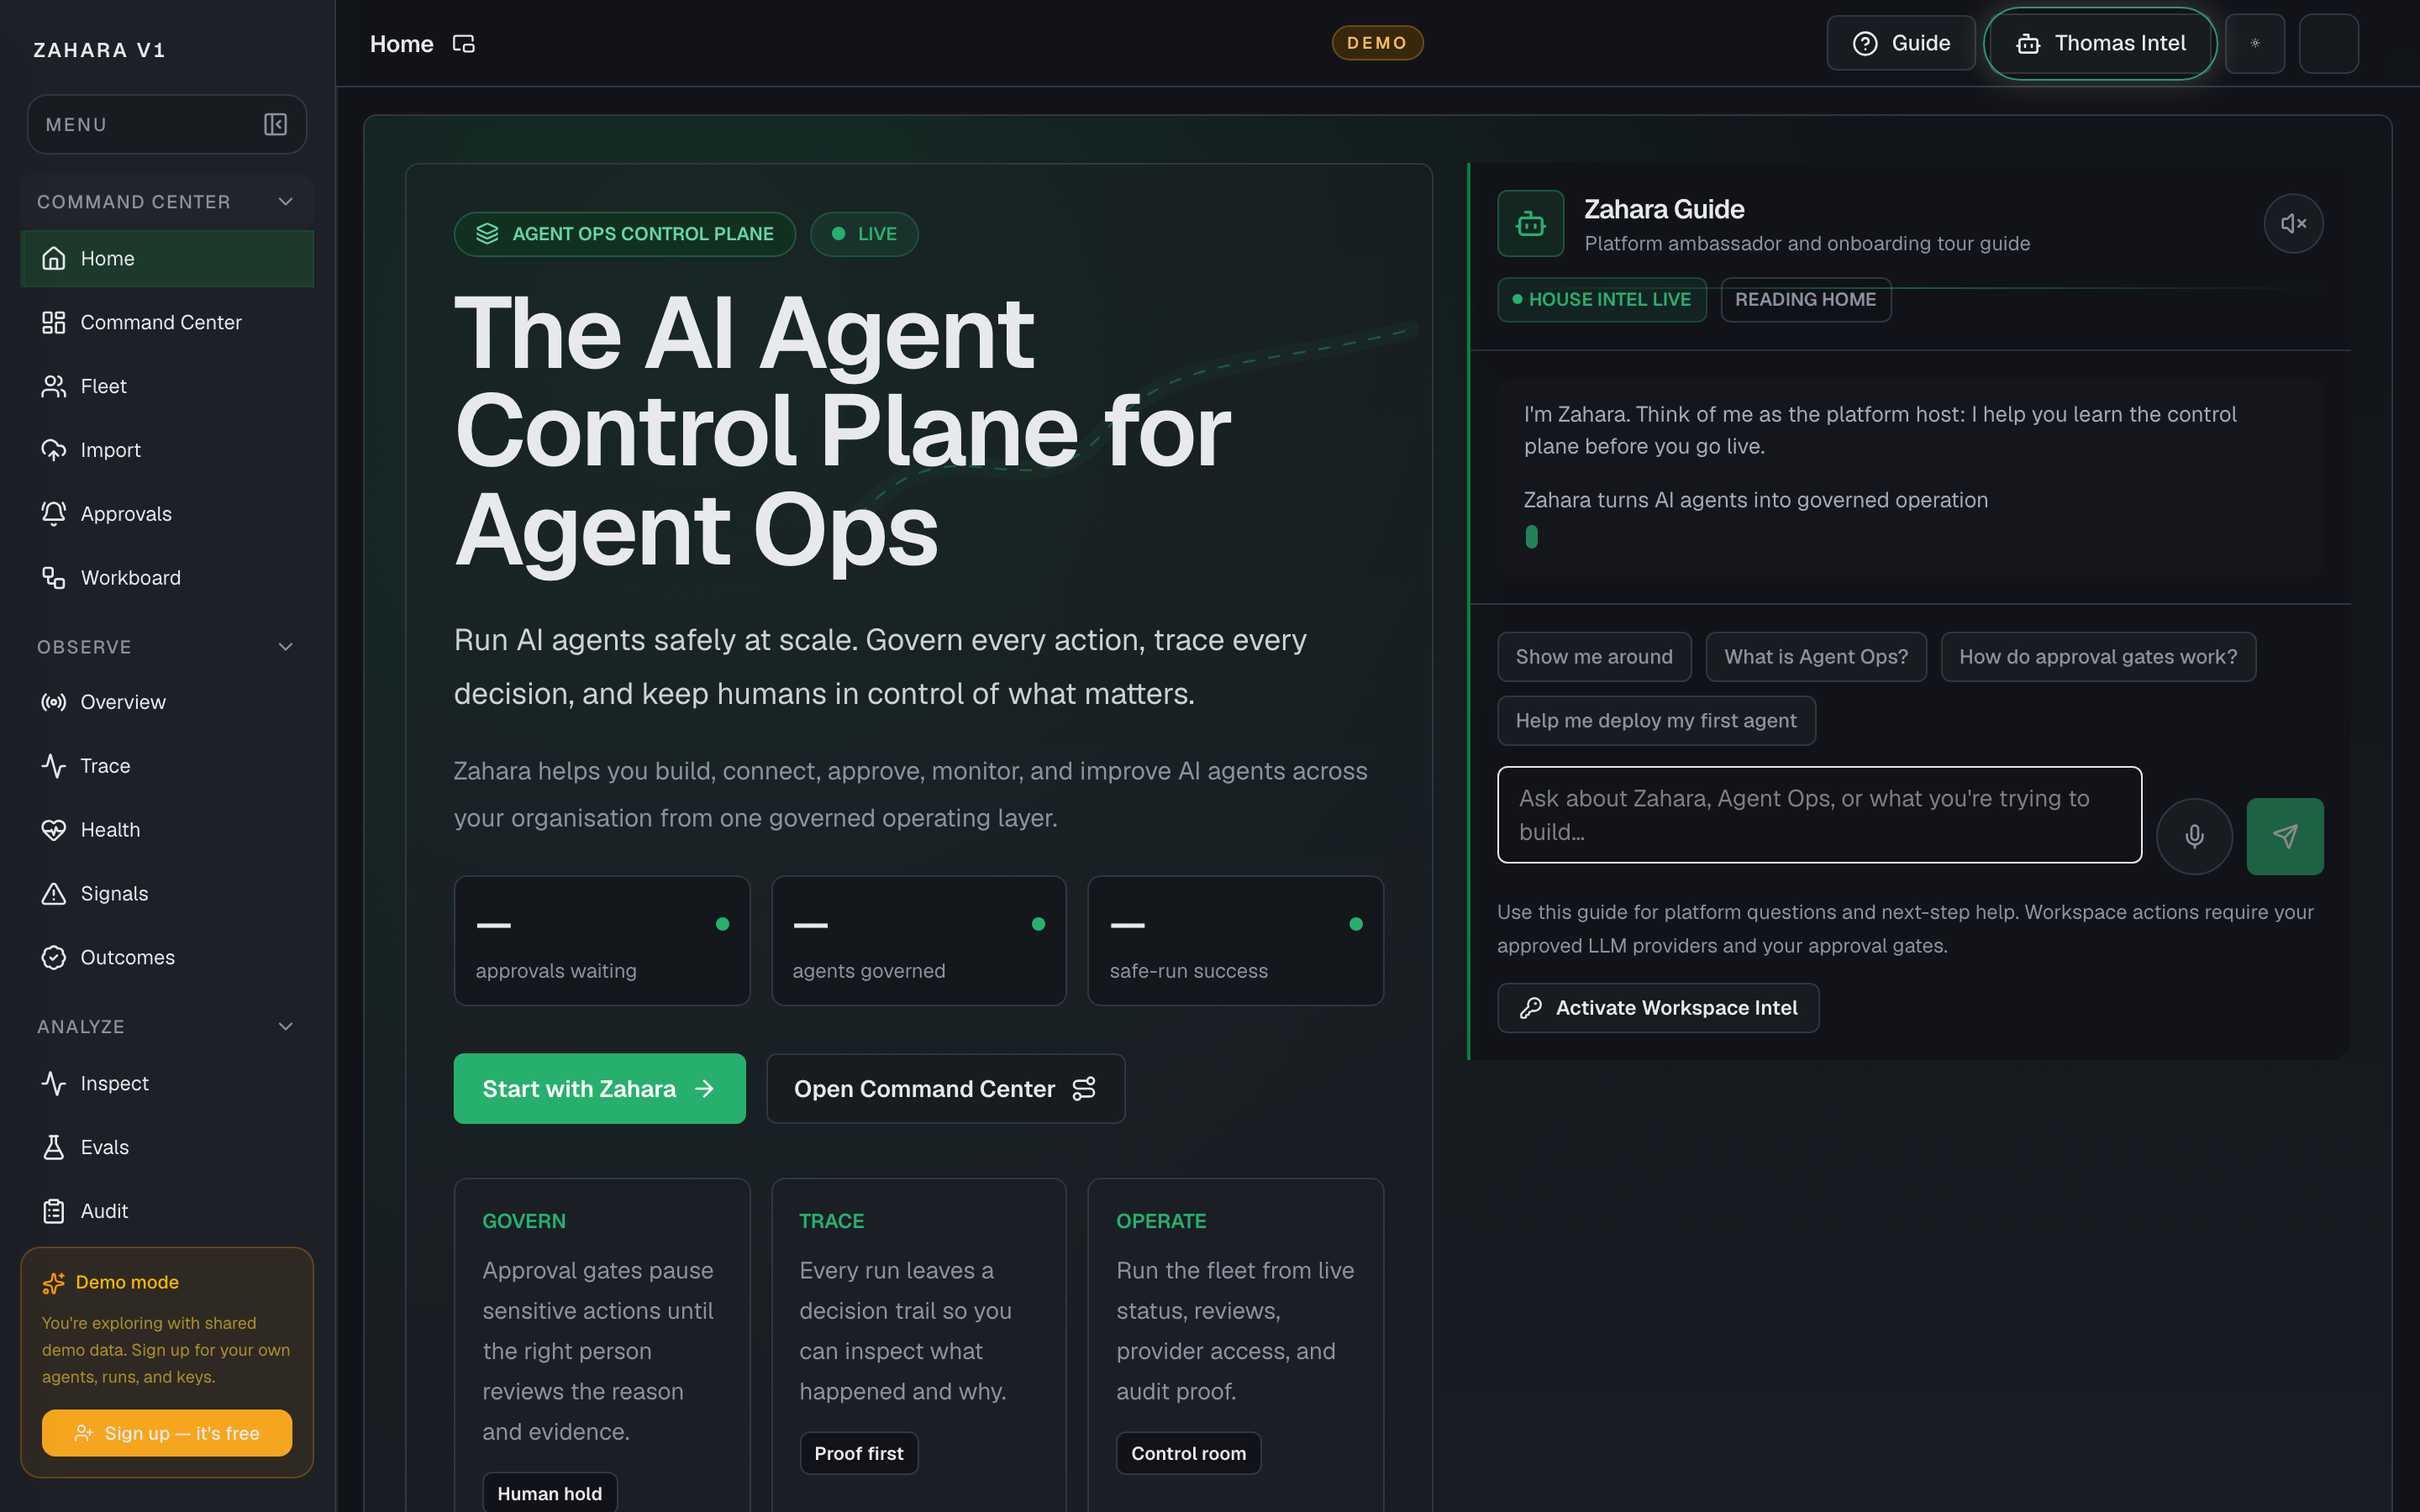
Home
What it is
Home is Zahara's first post-login landing surface: a guided entry point into the AI Agent Control Plane for Agent Ops.
Value to users
It helps a new user or returning operator understand Zahara, choose the right first path, and move into Command Center when they are ready to operate.
Use it when
- A new user has opened the platform and needs to understand what Zahara does.
- An operator wants guided context on Agent Ops, approval gates, workspace LLMs, or the safest first agent path.
- A workspace needs a safe path from learning to importing, building, governing, observing, and connecting agents.
Next safe action
Ask what Zahara does or what you are trying to build, then pick Import, Studio, Approvals, Observe, Integrations, or Command Center based on the answer.
Related Guide pages
Options and features
| Option | What it does | Value it adds | How to use it |
|---|---|---|---|
| Thomas Intel embedded chat | Lets the user ask Thomas Intel questions from the Home page without opening the sidecar. | Turns the first screen into a guided platform walkthrough while keeping Zahara's control plane clear. | Use starter chips or type a question; Thomas answers from the Home page guide and visible page context. |
| Start guided tour | Scrolls focus to the embedded Home guide. | Makes the recommended first action obvious for new users. | Use it when you want a guided explanation before opening an operational page. |
| Open Command Center | Navigates to the daily operating room for live fleet status and next safe actions. | Gives returning operators a direct path to work. | Use it after you know what needs attention or when you are ready to operate the workspace. |
| Platform path cards | Links to Import, Studio, Approvals, Observe, and Integrations. | Separates the main starting paths so users do not confuse importing with building. | Choose Import for existing agents, Studio for new agents, Approvals for governance, Observe for proof, and Integrations for providers and tools. |
| Learn cards | Send common first-run questions to the embedded guide. | Shows users that the Home page can teach the platform, not just present static links. | Pick a question; the page scrolls to the guide and shows the answer in the embedded chat. |
Basic workflow
- 1Read the control plane headline, check the live workspace signal, and note how many agents are governed, approvals are waiting, and runs succeeded.
- 2Use the guided tour or a starter chip to ask the first question.
- 3Use the platform path cards to choose Import, Studio, Approvals, Observe, or Integrations.
- 4Review platform updates if you want to see what recently changed.
- 5Use the control plane path to understand the full journey from learning to observing live work.
- 6Open Command Center once you are ready for the daily operating room.
Proof that it worked
- The hero shows Zahara as the AI Agent Control Plane for Agent Ops.
- Thomas Intel is embedded and open by default.
- Thomas Intel answers Home questions through `/api/thomas/main-chat`.
- Import and Build are separate cards that link to `/import` and `/studio`.
- Platform updates show user-facing shipped capabilities without source details, PR numbers, branch names, or internal implementation labels.
- The control plane path stays readable as one left-to-right journey.
Before you start
- Confirm you are on /home and looking at the right workspace.
- Read visible status, warning, or empty-state text before clicking an action.
- If the page shows IDs, copy the relevant agent, run, onboarding, or request ID before switching pages.
If you get blocked
- If the first path is unclear, choose the guided tour before Import or Studio.
- If a card sends you somewhere unexpected, use Command Center as the operating room and return here only for orientation.
- If Thomas gives a vague answer, ask it to choose between Import, Studio, Observe, Approvals, and Command Center using visible page context.
Useful Thomas questions
- I am new. Should I start with Import, Studio, Observe, or Command Center?
- Explain Zahara in one minute using this Home page.
- What should I click first if I already have agents running?
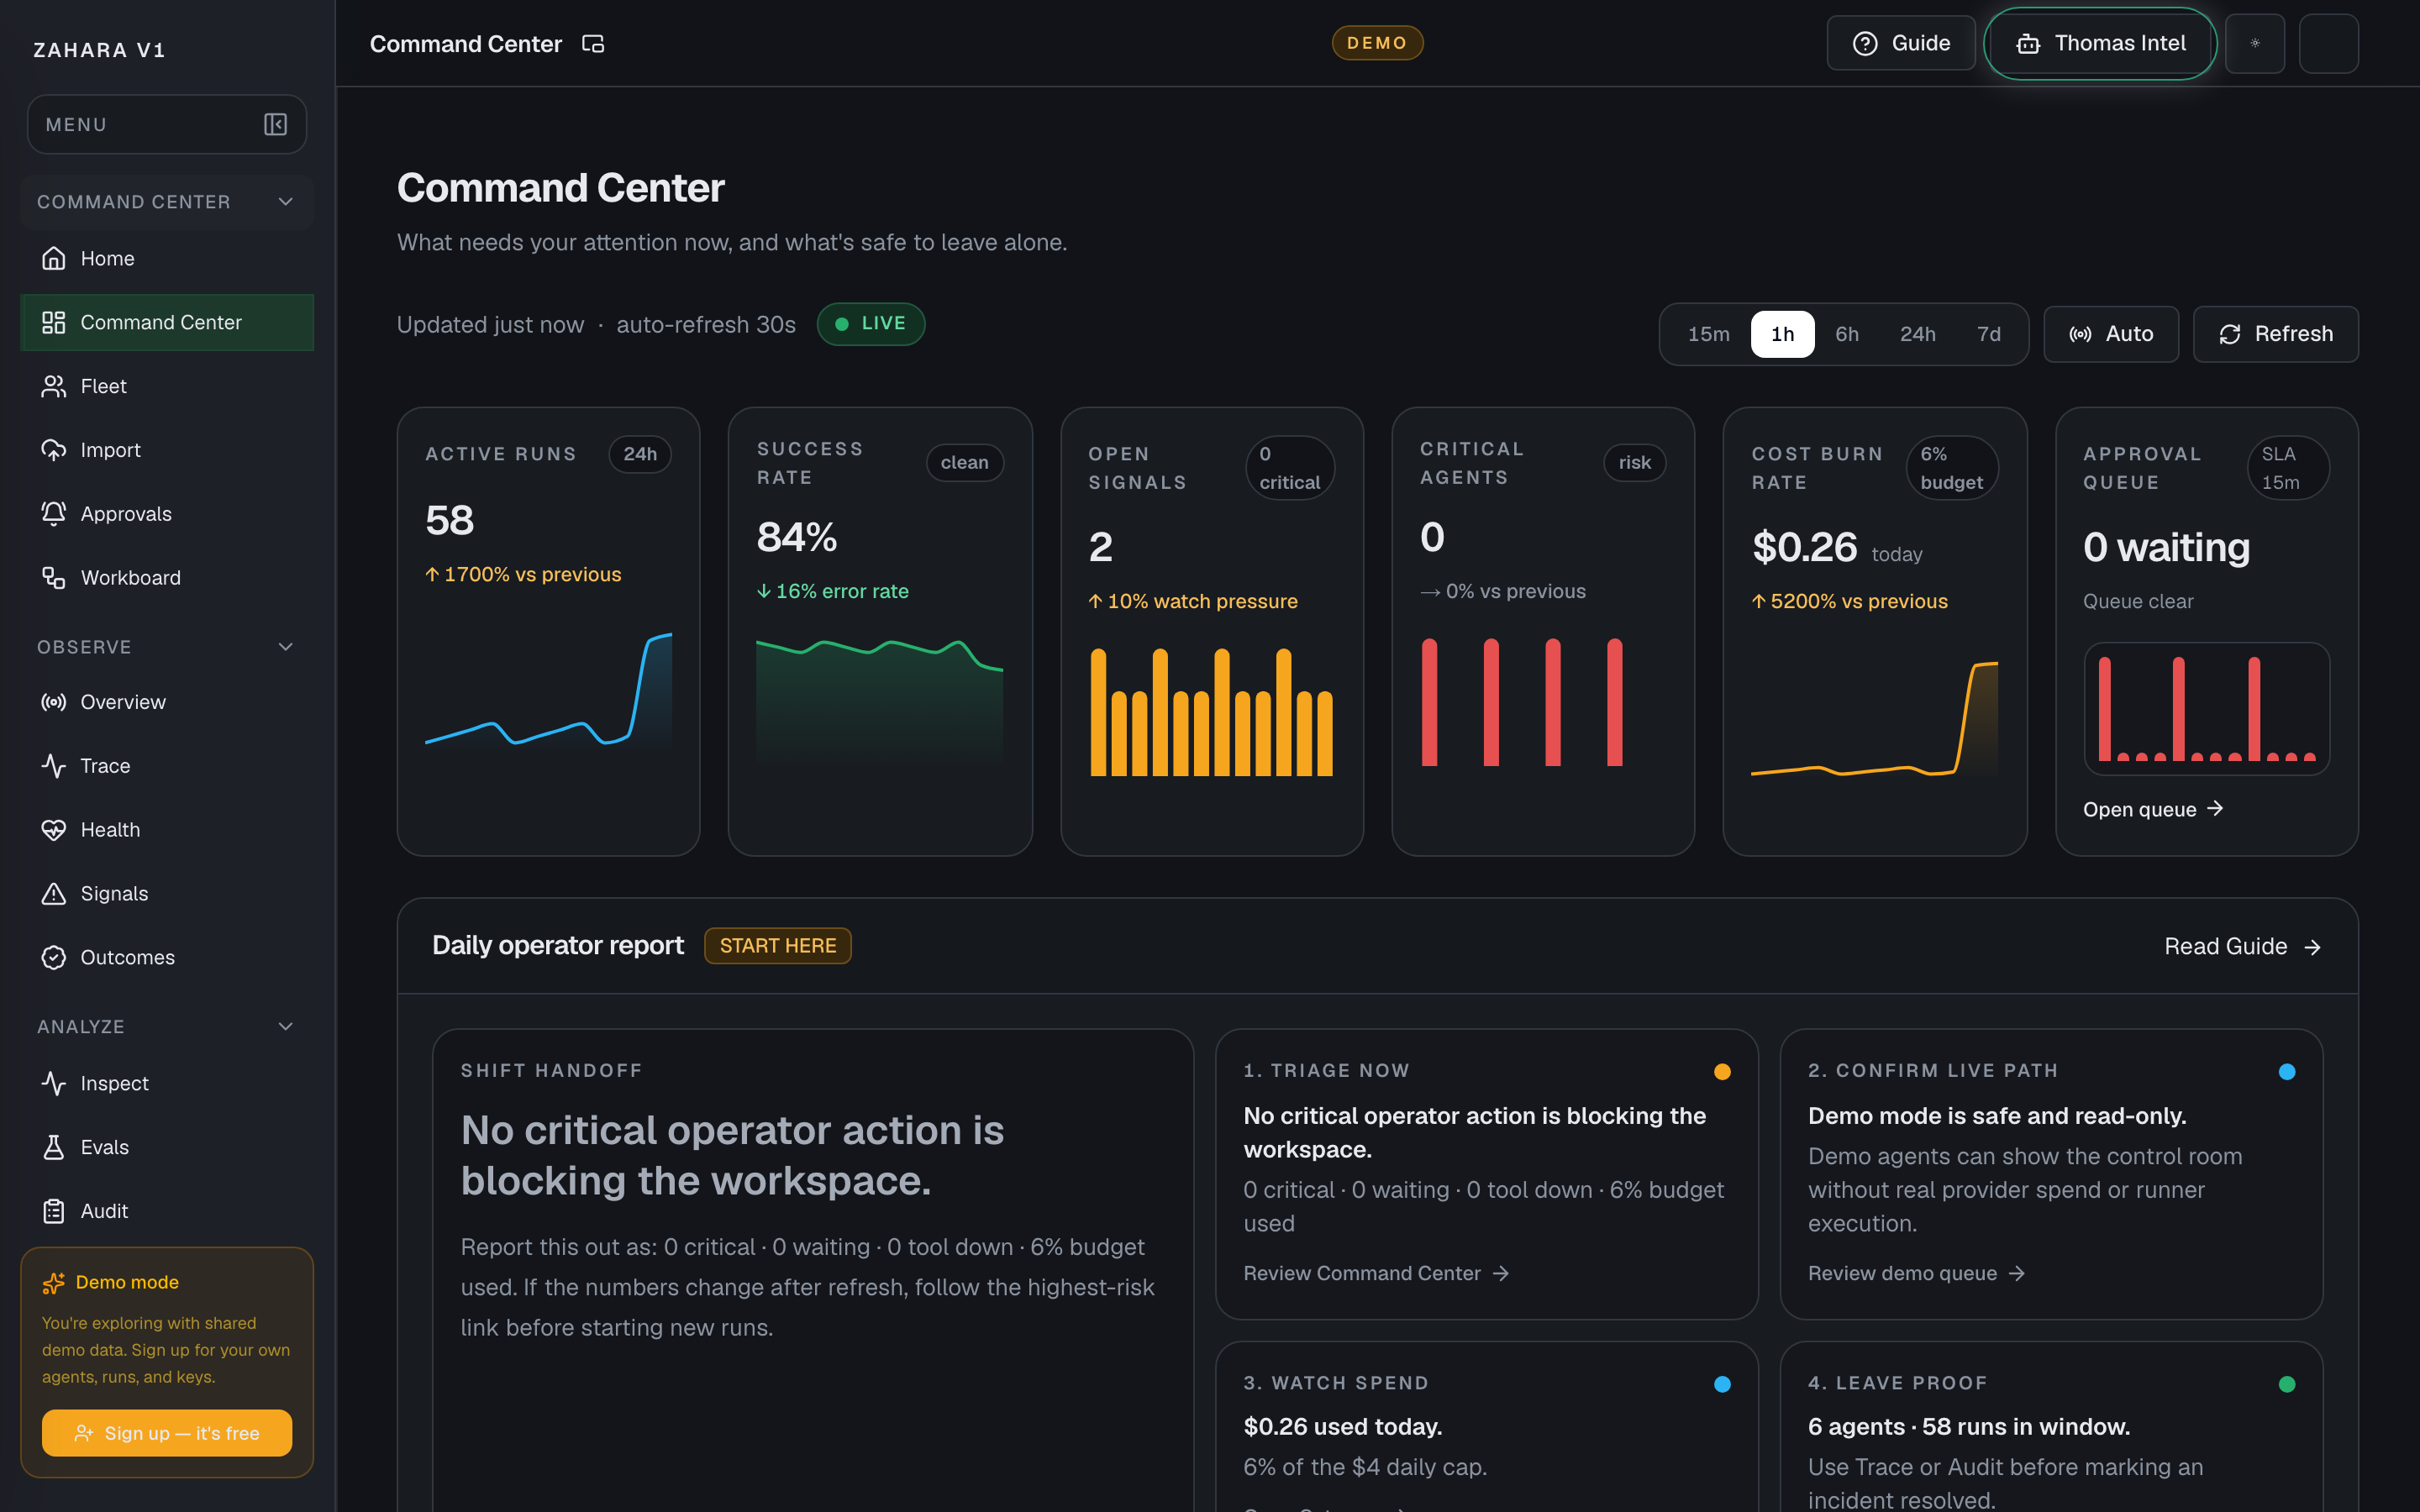
Command Center
What it is
Command Center is the daily operating room for a workspace: what needs you now, what is safe to leave alone, and proof of what just ran.
Value to users
It helps a team start from the right action instead of hunting through Fleet, Approvals, Inspect, Gateway, and Audit one page at a time.
Use it when
- Start your day by seeing critical agents, waiting approvals, down tools, cost, and active agents in one strip.
- Launch the right second-screen monitor for the role you are working: workspace, runtime, fleet, queue, approvals, or a single agent.
- Decide which warning needs a human and which parts of the fleet can keep running.
- Use approval aging and tool failure impact cards to see which reviews or integrations are blocking real work.
- Use the Agent status treemap and Fleet dependency graph to understand what else could break before changing tools or agents.
- Give a new reviewer a quick read on recent runs, failures, model spend, tool health, and quality checks.
Next safe action
Open the highest-risk item in What needs you, then use approval age, tool failure impact, or the linked detail page to approve, pause, fix, or inspect it.
Options and features
| Option | What it does | Value it adds | How to use it |
|---|---|---|---|
| Time window | Changes the activity period used by the run trend, cost, and health panels. | Keeps the page focused on a live incident or a longer pattern. | Pick the shortest useful window first, then widen it if the story is unclear. |
| Page pop-out | Opens the dedicated live monitors for Command Center, Observe, Fleet, Workboard, Approvals, and a single agent from one app-header control. | Lets an AgentOps team put different walls on different physical screens without changing shared workspace state. | Use the small pop-out icon beside the page title in the app header; the new window hides the left nav and header. |
| Customize layout | Lets an operator choose a Page View, customize the page, add or remove data blocks, move blocks, tune block settings, and save a personal copy. | Lets every operator shape Command Center around their job without forcing one shared dashboard on every team. | Use Customize this page on the full Command Center page for saved Page Views. Use `/command-center/live` only for the read-only second-screen monitor layout. |
| Page Views | Switches between the team default and personal page views for the current page. | Keeps power-user customization close to the page while the default view stays understandable for everyone else. | Pick a saved view from the page view menu, use Customize this page to edit a draft, then Save for me when the layout should persist after refresh. |
| Daily operator report | Turns the top workspace metrics into a start-of-shift checklist: triage now, confirm live path, watch spend, and leave proof. | Gives the operator a plain-English handoff they can read out loud before opening detail pages. | Read the Shift handoff copy first, follow the highest-risk link, then return to Command Center after the action is handled. |
| Live action readiness | Shows whether the workspace has a tested provider key, an online runner, queued Workboard work, and operator access. | Tells the operator whether it is safe to start a live card or whether the demo should stay monitor-only. | Read this card before pressing Start next in Workboard. Fix the linked setup item first if the card says SETUP. |
| What needs you | Lists agents, approvals, tool requests, budget issues, and latency warnings that need a person. | Turns scattered alerts into a clear review queue. | Start with red critical rows, then handle amber review rows if the fleet is otherwise healthy. |
| Approval queue age | Buckets pending approvals by wait time: under 1h, 1-6h, 6-12h, 12-24h, and 24h+. | Shows whether review work is becoming overdue before the queue looks large. | Click a bucket to open Inspect filtered to approvals in that age band, then clear the oldest reviews first. |
| Tool failure impact | Expands DOWN or WARN tools with affected agents, estimated blocked cost, and the suggested action. | Connects a tool outage to the exact agents and money at risk. | Open the red or amber tool card, review the affected agents, then investigate or dismiss it. |
| Guardrails | Shows whether latency, error rate, daily cost, and review wait are inside target. | Makes it obvious when the workspace is drifting before a customer notices. | Open Alerts or Gateway when a guardrail is breached or close to breach. |
| Metric sparklines | Shows active runs, success rate, open signals, critical agents, cost burn, and approval queue trend. | Gives ops a compact first read before they open detail pages. | Read this row first, then use the trend direction to decide whether the workspace is calming down or heating up. |
| Critical issues timeline | Shows incident windows for outages, error rate, budget spikes, tool down, and approval backlog over the last 24 hours. | Turns isolated alerts into an operational incident story. | Start with active red bars, then compare amber warnings with What needs you. |
| Agent status treemap | Groups the fleet by Healthy, Warning, Critical, and Paused. | Shows whether risk is concentrated or spread across the fleet. | Click a rectangle to open Fleet filtered to that status. |
| Fleet dependency graph | Maps agents, tools, APIs, and policies with cascade risk and fallback detail. | Shows what breaks downstream if a provider, tool, or policy node fails. | Click a node to enter What-if mode, read the detail panel, then export PNG if the graph needs to go into an incident note. |
| Safe to leave alone | Collapses healthy system checks into a low-priority section at the bottom of Command Center. | Keeps operator focus on active risk while still proving the quiet parts are healthy. | Open it when handing off a shift or when a reviewer asks what can keep running without attention. |
| Proof of what ran | Shows recent runs with agent, model, status, cost, latency, and the note that explains the outcome. | Lets reviewers verify behavior without guessing from a summary metric. | Use Recent runs for the quick read, then open Audit or Inspect for the full trail. |
Basic workflow
- 1Open Command Center at the start of a session.
- 2Use the page-title pop-out to open the walls this operator station needs on second, third, or fourth screens.
- 3Use the Page View menu when you need a saved team or personal Command Center layout.
- 4Use Customize this page to add, remove, move, or tune data blocks, then Save for me when the layout should persist after refresh.
- 5Use Customize layout in the live monitor only if this station needs a different second-screen card order.
- 6Read Daily operator report first so the shift starts from the right human action.
- 7Check Live action readiness before running a live Workboard card.
- 8Read the top strip for critical agents, waiting approvals, tool health, cost, and active agents.
- 9Handle the highest-risk row in What needs you.
- 10Use Approval queue age to clear the oldest pending reviews before they miss the review target.
- 11Expand any DOWN or WARN tool card to see affected agents and blocked cost.
- 12Use Critical issues timeline and Fleet dependency graph when risk might cascade.
- 13Check Guardrails and Activity trend to see whether the workspace is improving.
- 14Open Safe to leave alone only when you need the healthy-system proof.
- 15Use Proof of what ran before calling the issue resolved.
Proof that it worked
- No 404 or app error.
- The top strip, What needs you, Guardrails, Activity trend, Tool health, Quality, and Recent runs are visible.
- The app header exposes a small pop-out icon beside the current page title.
- The page pop-out opens the current surface in a chrome-free window instead of a fixed monitor picker.
- The Command Center monitor opens the same operating story in a read-only second-screen view.
- Page Views can switch between team default and personal layouts.
- Customize this page can add, remove, move, and tune data blocks before saving.
- Save for me persists the selected personal Page View after hard refresh.
- Demo workspaces clearly show synthetic/read-only context and should not expose confusing write flows.
- The live monitor Customize layout reorders cards locally and Reset layout restores the default order.
- Daily operator report shows triage, live path, spend, and proof checklist items.
- Live action readiness names provider key, runner, Workboard, and operator access status.
- Critical and warning rows link to the page where the user can act.
- Approval queue age shows pending buckets and an overdue-review callout when old reviews are waiting.
- Tool cards show affected agents and suggested action for DOWN or WARN tools.
- Metric sparklines show trend direction across the operating strip.
- Critical issues timeline renders incident windows or a clear empty state.
- Agent status treemap opens Fleet filtered by status.
- Fleet dependency graph supports node detail, What-if cascade mode, search, and PNG export.
- Safe to leave alone expands and collapses without hiding active-risk sections.
- Recent runs show status, cost, latency, and a clear note.
Before you start
- Confirm you are on /command-center and looking at the right workspace.
- Read visible status, warning, or empty-state text before clicking an action.
- If the page shows IDs, copy the relevant agent, run, onboarding, or request ID before switching pages.
If you get blocked
- If live data cannot load, do not treat the page as empty. Retry refresh, then check Fleet or Evals to see whether the API or one panel is down.
- If a metric spikes, open the linked detail page before changing an agent.
- If approval age is high, clear the oldest pending review before starting more live work.
Useful Thomas questions
- What needs attention right now on Command Center?
- Which item is safe to leave alone?
- What linked page should I open first and why?
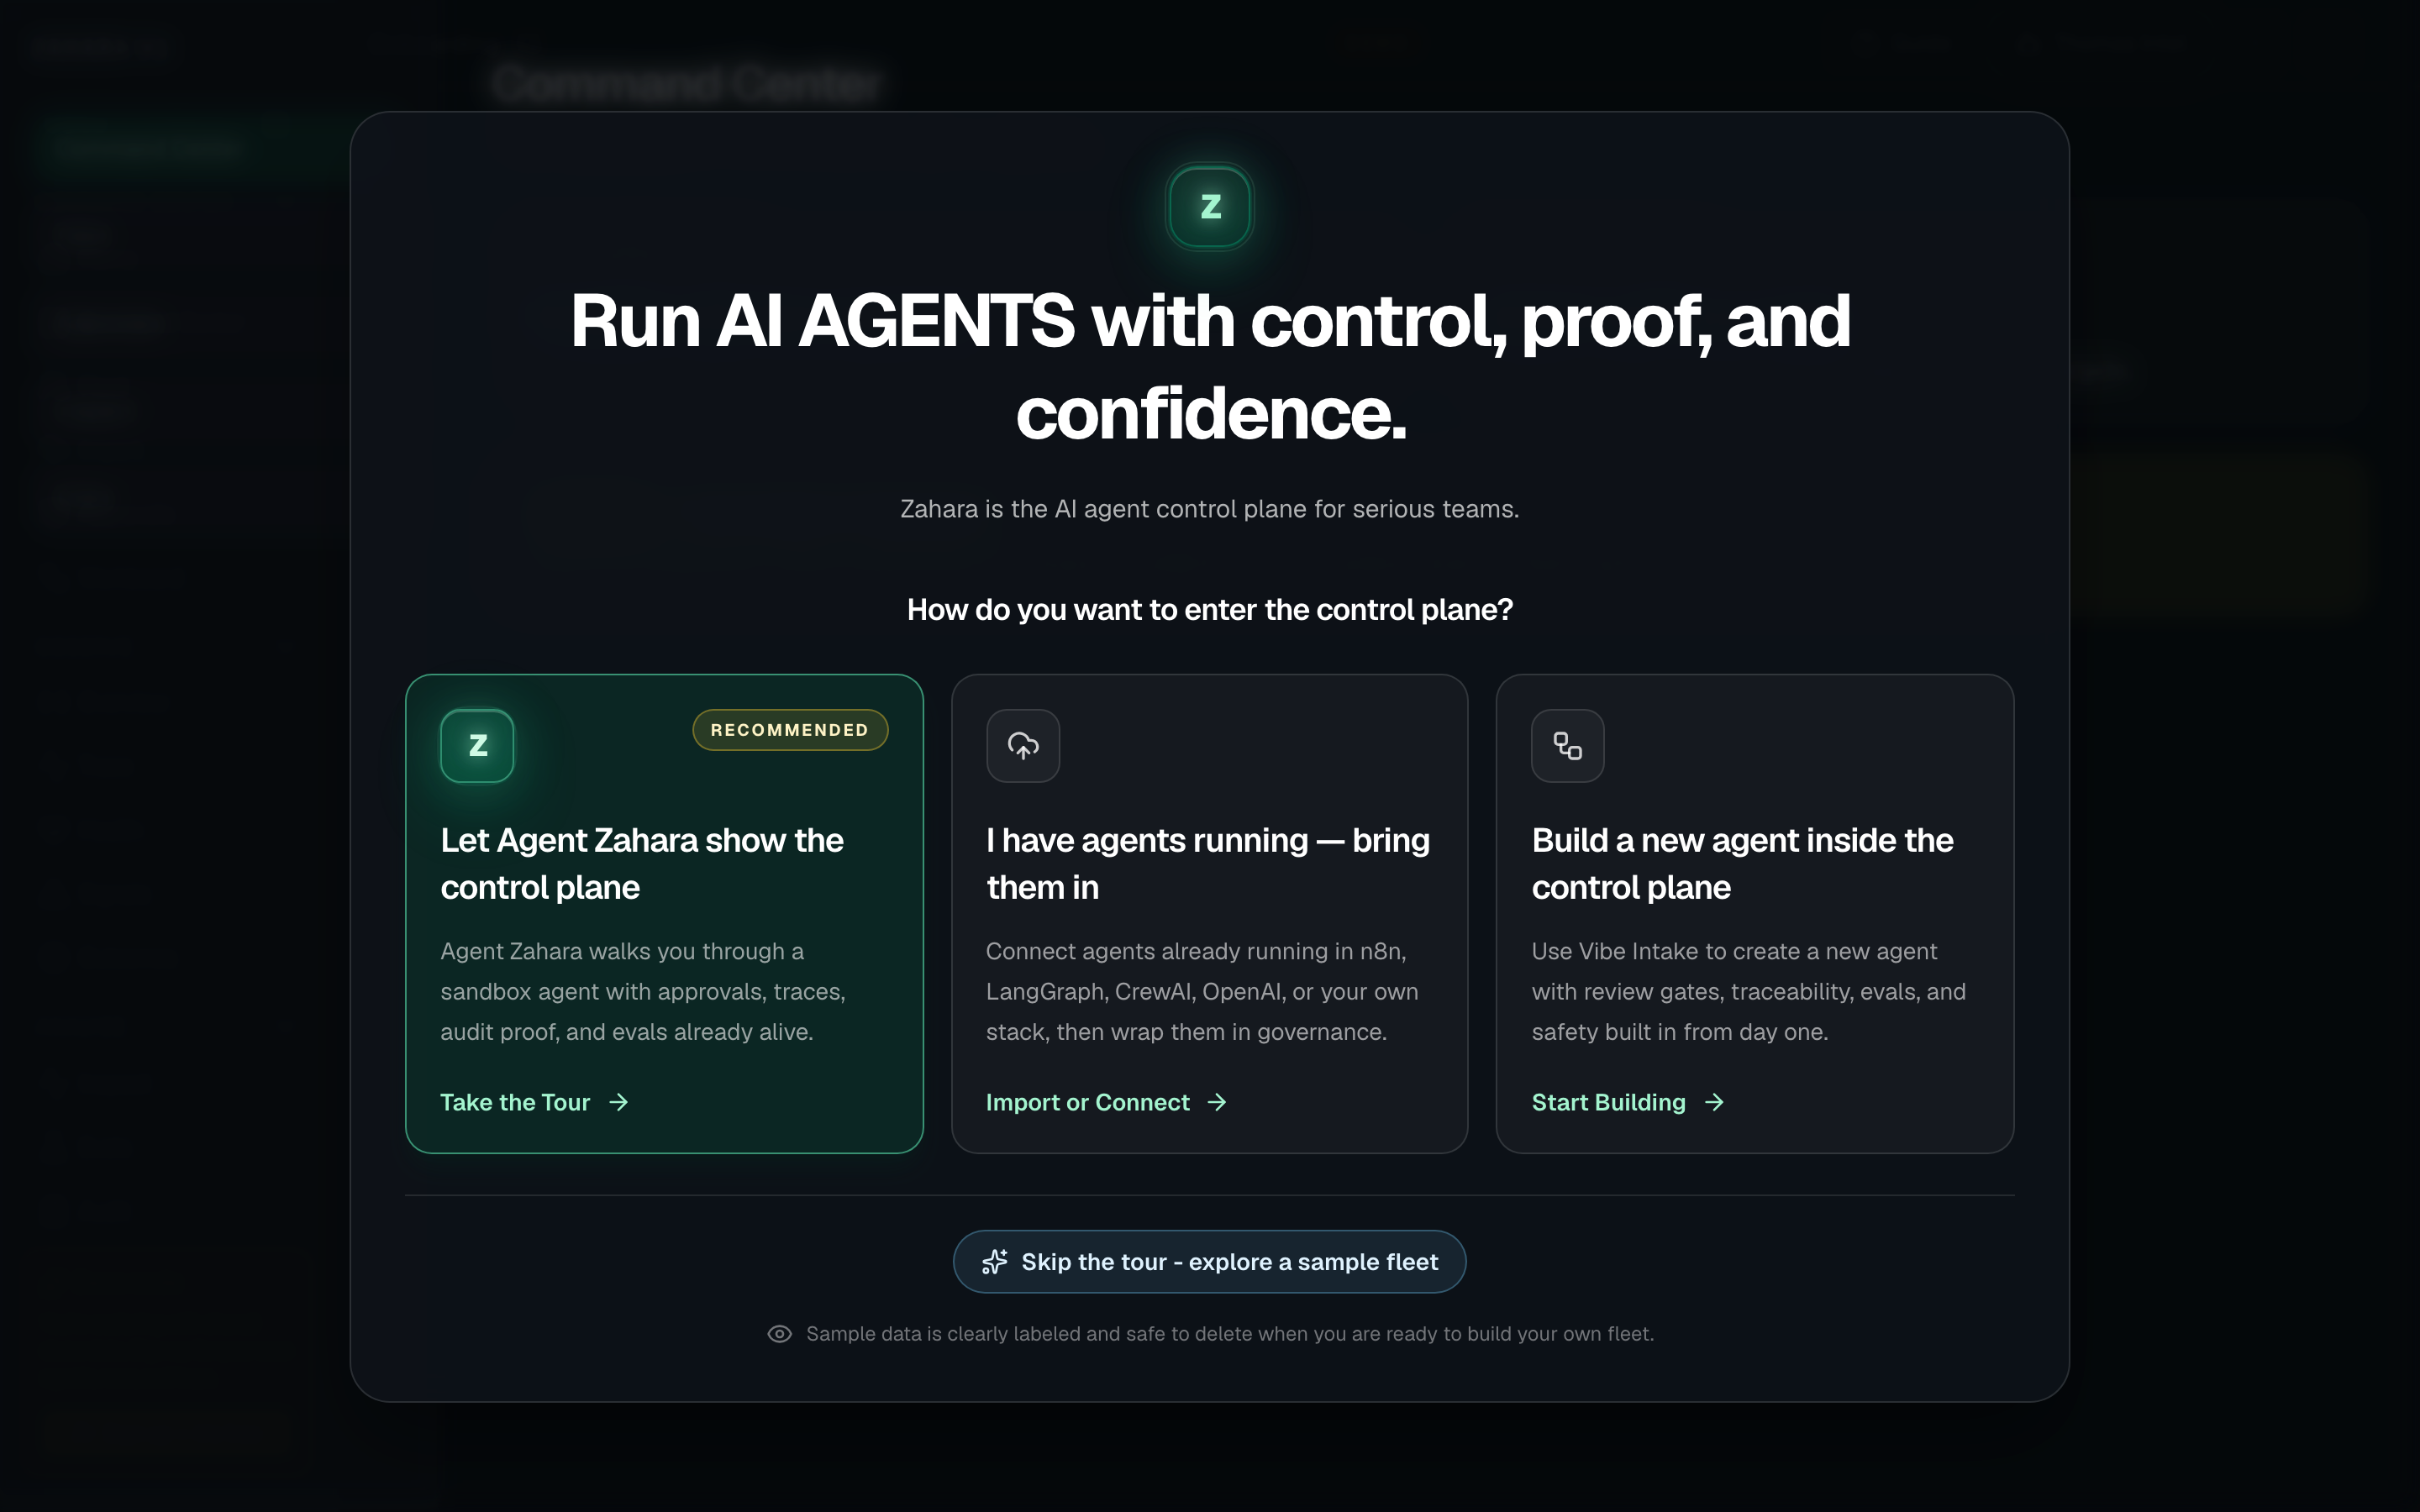
Onboarding
What it is
Onboarding is the entry point to the control plane. It gives every new user one clear choice: take the guided tour and see the control plane in action with a live sandbox, bring existing agents in from the outside, or build a new governed agent from scratch in Studio.
Value to users
It sets the right mental model immediately: Zahara is the control plane, not just a builder or importer. Every path leads to the same operating room: Command Center. The tour shows it with real evidence. Import and Build get there with the user's own agents.
Use it when
- A first-time user signed in and needs to understand where to begin.
- A buyer wants to understand Zahara before connecting provider keys.
- An operator needs to see the control plane loop before deciding whether to import, connect, or build.
Next safe action
If this is your first time, choose the guided tour. Zahara opens Command Center so you can see the control plane operating before you connect or build anything real.
Related Guide pages
Options and features
| Option | What it does | Value it adds | How to use it |
|---|---|---|---|
| Control plane tour | Schedules Zahara to open on Command Center and walk the user through the sandbox agent. | Shows the differentiated loop first: Agent Zahara explains signal, govern, trace, prove, and evaluate while the user sees a live sandbox. | Choose Let Agent Zahara show the control plane if this is your first time or you want the recommended guided tour. |
| Import | Records that the user wants to bring existing agents under Zahara control. | Matches enterprise reality: many teams already have agents, but lack governance, approvals, trace proof, eval coverage, and audit trails. | Choose I have agents running — bring them in when the user has a file, pasted config, repository source, or an outside runtime. |
| Build | Records that the user wants to build a new governed agent. | Keeps builder capability available without letting the crowded agent-builder category define Zahara's first impression. | Choose Build a new agent inside the control plane when you want Thomas in Vibe, Flow, Pro, or Import inside Zahara's governed activation path. |
| Skip for now | Marks onboarding complete and opens Home without auto-launching Zahara. | Respects experienced users while keeping the Zahara guide available from Home. | Use it only when the user explicitly wants to explore alone. |
Basic workflow
- 1Open Onboarding after first sign-in or signup.
- 2Show the welcome modal over the blurred platform preview.
- 3Ask one question: how does the user want to start?
- 4Lead with the recommended control plane tour.
- 5If they pick the tour, schedule Zahara to open on Command Center and introduce the sandbox agent.
- 6If they pick Build or Import, record the choice and send them to Command Center without auto-launching the guide.
- 7If they skip, send them to Home where Zahara can guide their first path.
Proof that it worked
- The page shows a centered control plane welcome modal over the blurred app.
- The three choices are Let Agent Zahara show the control plane, I have agents running - bring them in, and Build a new agent inside the control plane.
- The control plane tour is marked Recommended and schedules the Zahara guided tour.
- The preview names the Demo Support Triage Agent and explains that nothing sends, spends, or touches real data.
- Build and Import choices still land on Command Center so the user first sees the operating room.
- The page guide opens from the app header and links to `/docs#onboarding`.
Before you start
- Confirm you are on /onboarding and looking at the right workspace.
- Read visible status, warning, or empty-state text before clicking an action.
- If the page shows IDs, copy the relevant agent, run, onboarding, or request ID before switching pages.
If you get blocked
- If you are new, choose the recommended tour; it opens Command Center first so you can see the operating room before building anything.
- If Build or Import lands on Command Center, that is intentional: Zahara shows the control plane before you connect or create real agents.
- If you skipped onboarding too early, use Home or this manual to restart from the Day 1 quick start.
Useful Thomas questions
- Which onboarding path should I choose if this is my first time?
- Why does Build or Import land on Command Center first?
- Show me the safest demo path before I connect anything real.
Trace Connect
What it is
Trace Connect is an advanced integration for teams that already have agents running in external tools and want those runs observed in Zahara before migration.
Value to users
It lets an operator start with proof, not a rewrite: external runs create Zahara run, step, Observe, and Audit evidence while the original agent keeps running where it already lives.
Use it when
- A team has an OpenAI, LangGraph, CrewAI, AutoGen, n8n, or custom agent already running.
- An operator needs daily visibility before a full import or migration is worth doing.
- A beta user wants to prove latency, tool calls, cost, errors, and audit posture from an outside runtime.
Next safe action
Use Trace Connect only after you understand runs and audit proof. Create a scoped token, send a test heartbeat, choose the starter recipe for the runtime the team already uses, then confirm it appears in Observe, Inspect, and Audit before wiring production traffic.
Related Guide pages
Options and features
| Option | What it does | Value it adds | How to use it |
|---|---|---|---|
| Trace Connect access | Creates and revokes scoped ingest tokens for external runtimes. | Lets a running worker connect without borrowing a browser JWT. | Name the bridge, create the token, copy the one-time token or snippets, then store it in the worker environment. |
| Starter recipes | Shows copyable OpenAI Agents, LangGraph, CrewAI, AutoGen, n8n, and Dify wrappers. | Turns this advanced HTTP intake into a paste-ready first proof path for common agent stacks. | Pick the runtime, create a token for a paste-ready secret, copy the recipe, then run one safe heartbeat before production traffic. |
| Send test heartbeat | Uses the one-time `ztc_...` token to send a safe terminal heartbeat event. | Proves the token, API path, run creation, token request count, and Trace link before a real worker is connected. | After creating a token, click Send test heartbeat and open the returned Trace run. |
| POST /trace-connect/tokens | Creates a token for the current workspace/team and returns the plain secret once. | Gives onboarding a safe, repeatable setup step for OpenAI Agents, LangGraph, CrewAI, AutoGen, n8n, and custom workers. | Admins create tokens; Zahara stores only the hash and display prefix. |
| POST /trace-connect/events | Accepts a single run, tool, model, handoff, guardrail, message, or error event. | Creates the normalized evidence Zahara can show in Observe and Audit. | Use `Authorization: Bearer ztc_...` or an authenticated operator session, include `trace_id`, `event_type`, and a safe `name`, then add optional model, provider, tokens, cost, framework, span, and metadata fields. |
| DELETE /trace-connect/tokens/{token_id} | Revokes a token without deleting the audit trail or prior run evidence. | Gives operators a clean rotation path when a bridge is retired or a customer environment changes. | Use the setup surface or call the endpoint as an admin in the same workspace. |
| GET /trace-connect/events | Lists recent Trace Connect events for the active workspace. | Gives operators a quick proof check without leaving the platform. | Filter by `trace_id` when confirming a single external run. |
| Agent link | Links incoming events to an existing Zahara agent when `agent_id` or `agent_slug` matches. | Keeps external evidence attached to the right Fleet record without creating ghost agents. | Use `agent_slug` for existing Zahara agents; omit it for generic external traces that are not mapped yet. |
| Secret-safe metadata | Redacts secret-looking keys and previews before storing event payloads. | Keeps Trace Connect useful for debugging without turning it into a credential sink. | Send only operational metadata; Zahara still redacts common key, token, password, and authorization fields. |
Basic workflow
- 1Pick one external agent or workflow to observe.
- 2Confirm the workspace and admin/operator role are correct.
- 3Create a Trace Connect token and store the one-time secret in the external runtime.
- 4Click Send test heartbeat and verify Zahara accepts a terminal `run.completed` event before adding the token to production code.
- 5Choose the matching starter recipe for OpenAI Agents, LangGraph, CrewAI, AutoGen, n8n, or Dify.
- 6Send a `run.started` or `message` event with a stable `trace_id`.
- 7Send tool, model, handoff, guardrail, or error events with `span_id` when available.
- 8Send `run.completed` or `run.error` when the external run finishes.
- 9Open Observe / Health or Observe / Trace and confirm the run evidence is visible.
- 10Open Audit and filter for `trace_connect.event_received` if the operator needs tamper-evident proof.
- 11Revoke any token that was created only for testing.
Proof that it worked
- Trace Connect token tooling can list, create, and revoke scoped tokens.
- Token create responses include a one-time secret plus curl and Python snippets.
- Send test heartbeat accepts one safe event, increments the active bridge count, and links to the Trace run.
- The starter recipe picker includes OpenAI Agents, LangGraph, CrewAI, AutoGen, n8n, and Dify.
- Selecting a recipe updates the setup guidance, emitted event types, and copyable snippet.
- `POST /trace-connect/events` returns `ok: true`, `run_id`, and the normalized event item.
- A Zahara `Run` row is created with source `trace_connect` and request id equal to `trace_id`.
- Tool and model events create run-step evidence for Observe and Inspect.
- Audit records `trace_connect.event_received` for every accepted event.
- Audit records token create/revoke events for credential changes.
- Events are scoped to the active workspace and are not visible to other accounts.
- Secret-looking metadata fields are redacted before they are stored.
Before you start
- Confirm you are on /trace-connect/events and looking at the right workspace.
- Read visible status, warning, or empty-state text before clicking an action.
- If the page shows IDs, copy the relevant agent, run, onboarding, or request ID before switching pages.
If you get blocked
- If events do not appear, send a test heartbeat before wiring production traffic.
- If the token fails, create a fresh token and copy the one-time secret into the external runtime.
- If the event is unmapped, include agent_id or agent_slug only after the target agent exists in Fleet.
Useful Thomas questions
- How do I prove Trace Connect is working with a test heartbeat?
- Which starter recipe matches my external agent runtime?
- Why did this external event not map to an agent?
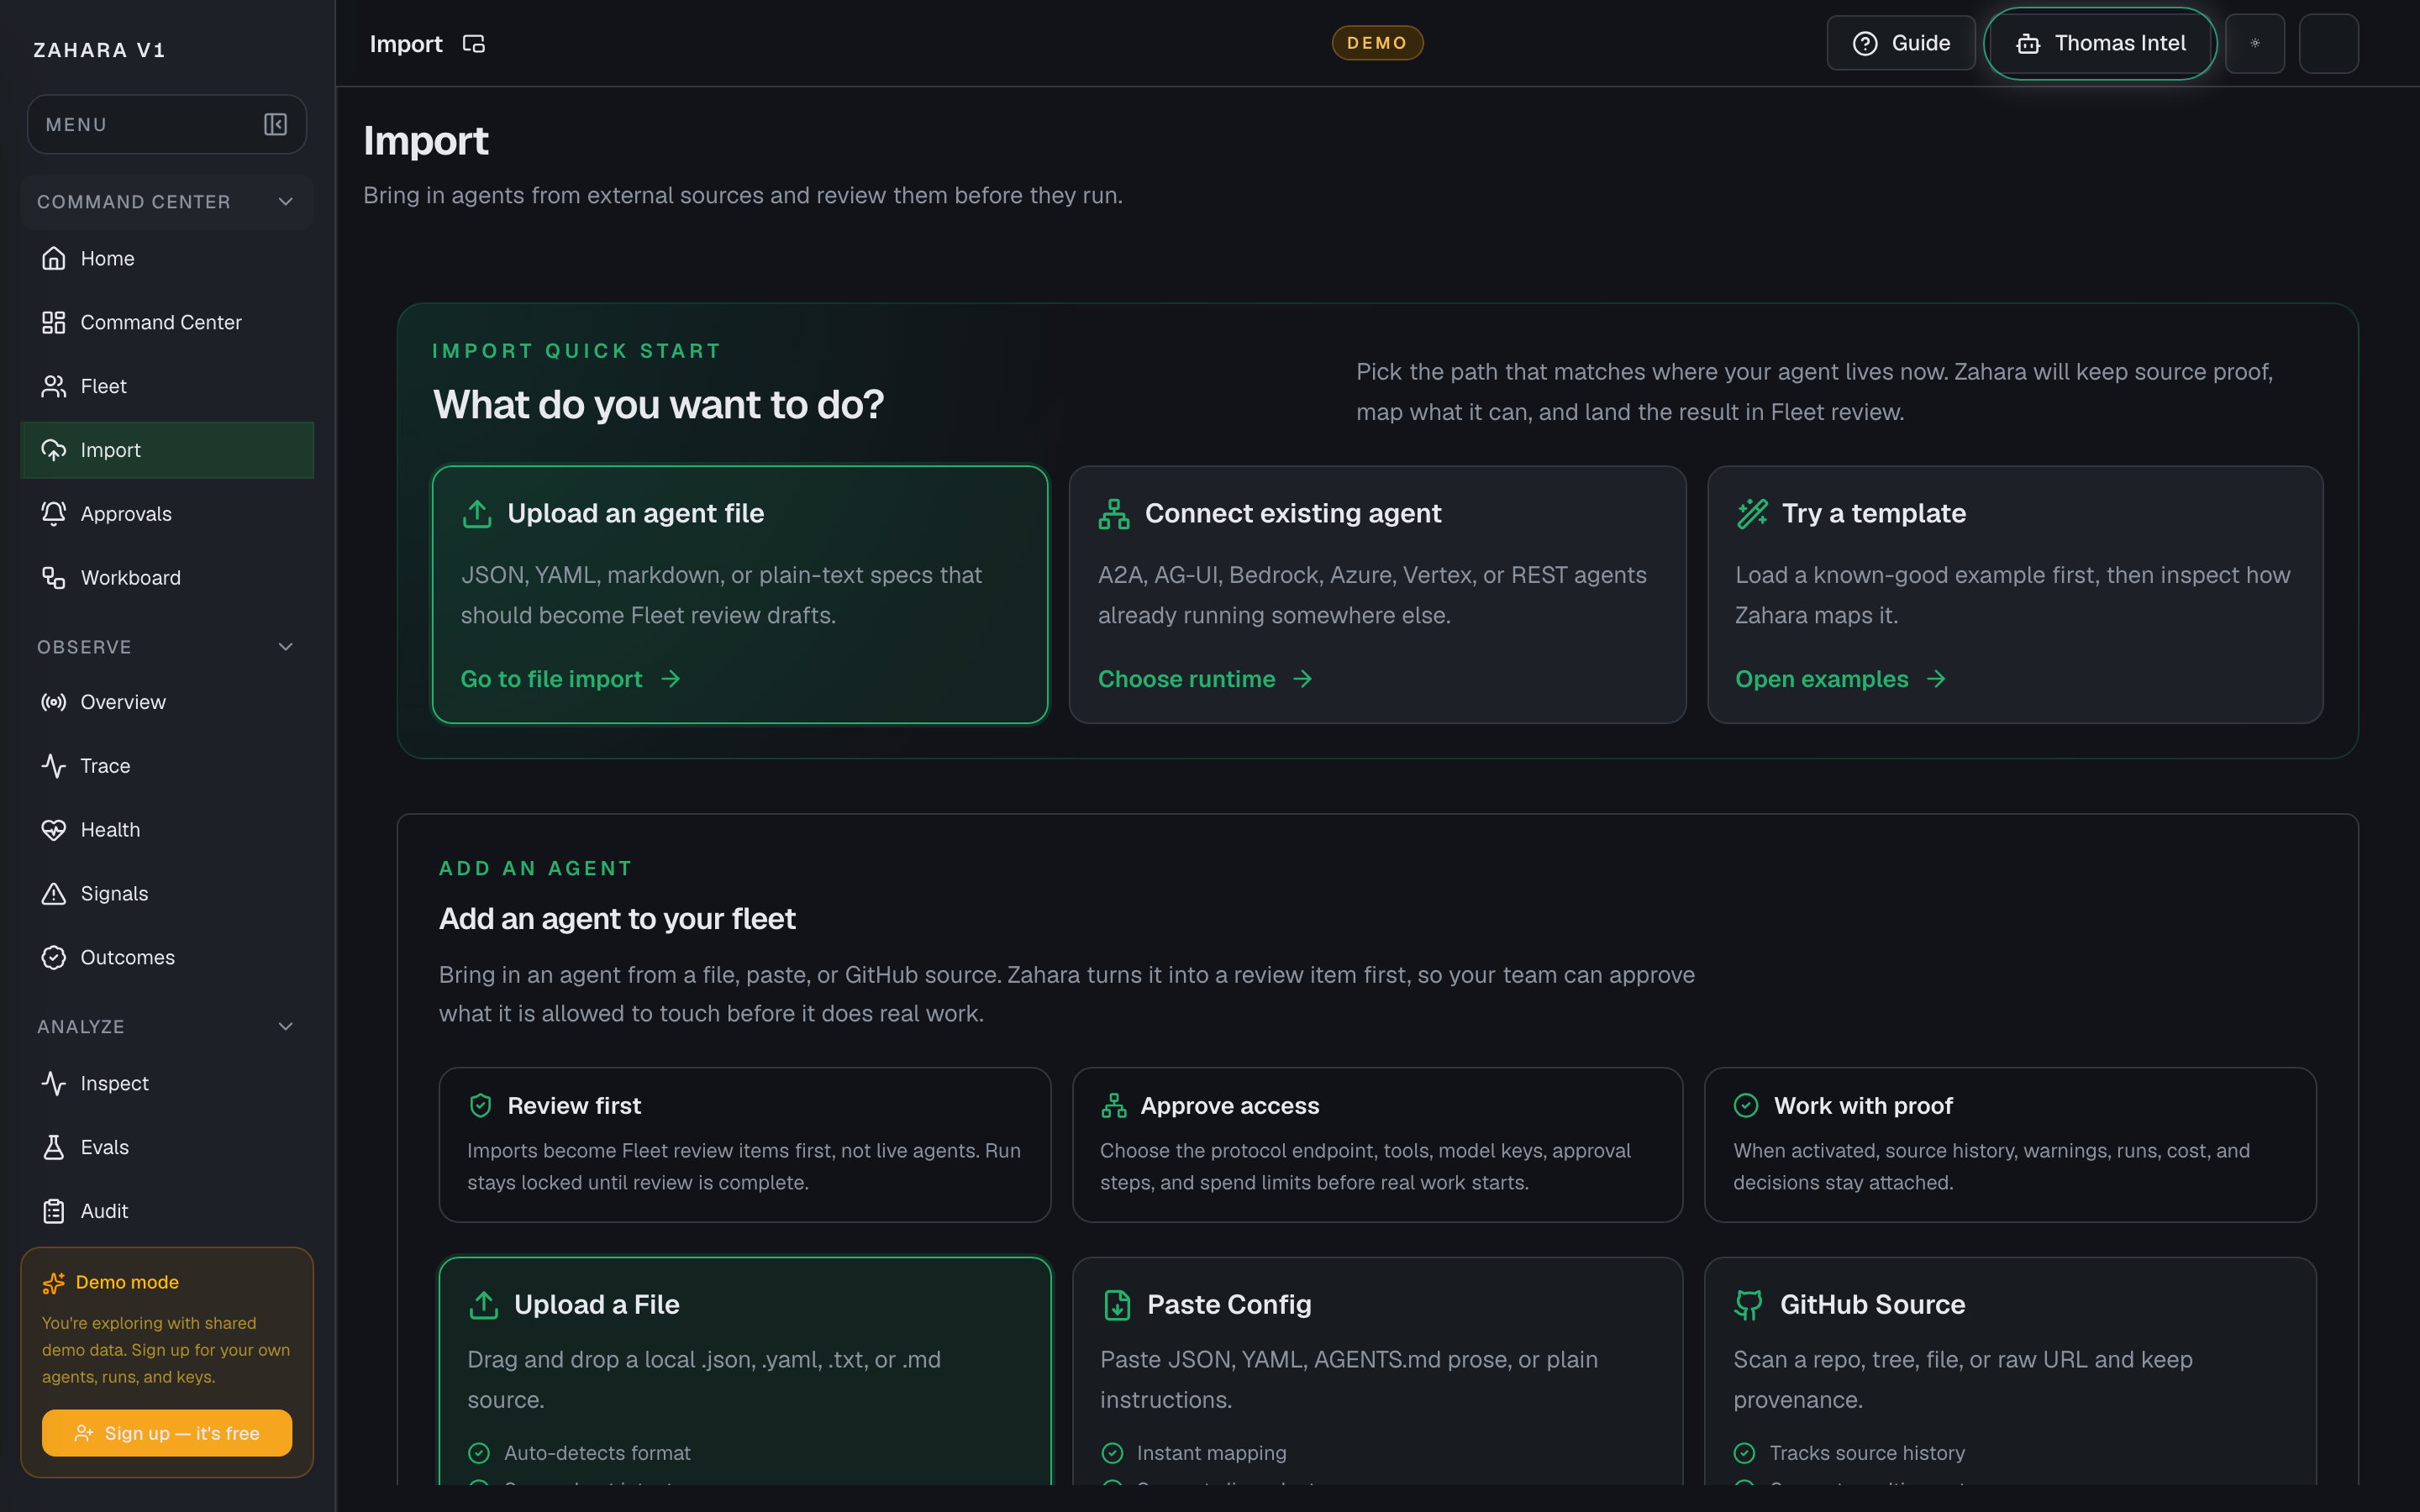
Import
What it is
Import brings an outside agent source into Zahara for review before it can run. Upload, paste, GitHub, API, and CI/CD paths all land in the same review-first flow.
Value to users
It lets teams reuse existing agent work without blindly trusting it. Zahara now recognizes 39 formats across native specs, Python frameworks, visual builders, cloud platforms, and emerging agent configs, then shows detected format, mapped fields, warnings, tool references, model route, credentials, and secret signals.
Use it when
- Upload a local JSON, YAML, markdown, prompt, OpenAPI, Bedrock, LangChain, CrewAI, n8n, Dify, or other supported source file.
- Paste a config or describe an agent in plain English when a file is not ready yet.
- Scan GitHub or wire API/CI/CD when the source should stay attached to a repo workflow.
- Preserve a source record before activation.
- Check readiness and warnings before creating a Fleet review row.
Next safe action
Use Quick Start to choose Upload, Connect, or Template, load the source, confirm the detected adapter, read readiness and warnings, then send it to Fleet review only if it is worth reviewing. An adapter is how Zahara reads and maps your agent's source format.
Options and features
| Option | What it does | Value it adds | How to use it |
|---|---|---|---|
| Quick Start | Separates Upload an agent file, Connect existing agent, and Try a template before the user enters the detailed import area. | A new user can choose intent first instead of guessing which format tab matters. | Pick Upload for a local file, Connect for a remote/cloud agent, or Template when you want a known-good example. |
| Upload a file | Accepts local .json, .yaml, .yml, .txt, and .md sources, auto-detects the adapter, keeps the raw source, and starts Upload -> Review -> Activate. | Users can bring real work in quickly while Zahara keeps the source inactive until review. | Drop the file or click the upload zone, then verify the detected format and readiness panel before sending to Fleet. |
| Paste modes | Lets users paste a config or describe the agent in plain English without leaving the page. | Supports both structured imports and early-stage ideas without turning paste into a confusing side path. | Keep Paste a config for JSON, YAML, markdown, or prompts. Switch to Describe in plain English when you want Zahara to generate the spec for you. |
| GitHub URL scanner | Downloads supported agent files from GitHub and detects the source format. | Lets users start from real work instead of rebuilding agents by hand. | Paste the file or folder URL, scan, choose a candidate, then continue to mapping. |
| 39-format support panel | Groups support into Native, Python Frameworks, Visual Builders, Cloud & Enterprise, and Advanced formats. | Builders can quickly find LangChain, CrewAI, OpenAI, Bedrock, n8n, Dify, OpenAPI + Prompt, Cursor rules, and other ecosystem sources. | Use auto-detect first. Open the format panel when you need to inspect coverage, force a mapping, or check whether a cloud format needs credentials during review. |
| Send to Fleet for review | Creates an onboarding row with preserved source evidence. | Moves the source into the governed Build / Import / Connect -> Review -> Activate loop. | Click only after the readiness panel and warnings have been checked. |
| Supported formats disclosure | Keeps the full format matrix available without competing with the main import action. | Users can move fast first, then expand the deeper format detail only when they need it. | Open it when you want to override auto-detection or check whether a source is full or partial coverage. |
Basic workflow
- 1Choose Upload, Connect, or Template from Quick Start. Choose the tab that matches the source you have right now.
- 2Load the file, paste the config, describe the agent, scan GitHub, or use API/CI/CD.
- 3Confirm the detected adapter or open Supported formats if you need an override.
- 4For cloud and enterprise sources, note credentials that must be set during review.
- 5Review mapped fields, not-mapped fields, warnings, model route, tools, and secrets.
- 6Send to Fleet for review.
- 7Open the new Fleet review row.
Proof that it worked
- One tabbed action area is visible immediately on page load.
- Quick Start scrolls to the matching Upload, Connect, or Template section.
- Upload, paste, and GitHub inputs stay separated.
- Upload explains supported files, source preservation, Fleet review, and version history.
- Supported formats shows 39 formats across the five current tabs.
- Bedrock, Azure, and Vertex show credentials-set-during-review warnings.
- Detected adapter is visible after a source is loaded.
- Readiness panel is present.
- Warnings are preserved.
- Onboarding ID is created after sending to Fleet.
Before you start
- Confirm you are on /import and looking at the right workspace.
- Read visible status, warning, or empty-state text before clicking an action.
- If the page shows IDs, copy the relevant agent, run, onboarding, or request ID before switching pages.
If you get blocked
- If the source does not map cleanly, do not activate it. Read warnings and unsupported fields first.
- If an adapter is unknown, use Supported formats or paste a smaller source before sending to Fleet.
- If secrets appear in the source, remove or rotate them before review.
Useful Thomas questions
- What did Zahara detect in this import?
- Which warnings must I review before sending this to Fleet?
- Is this source safe to activate or only safe to review?
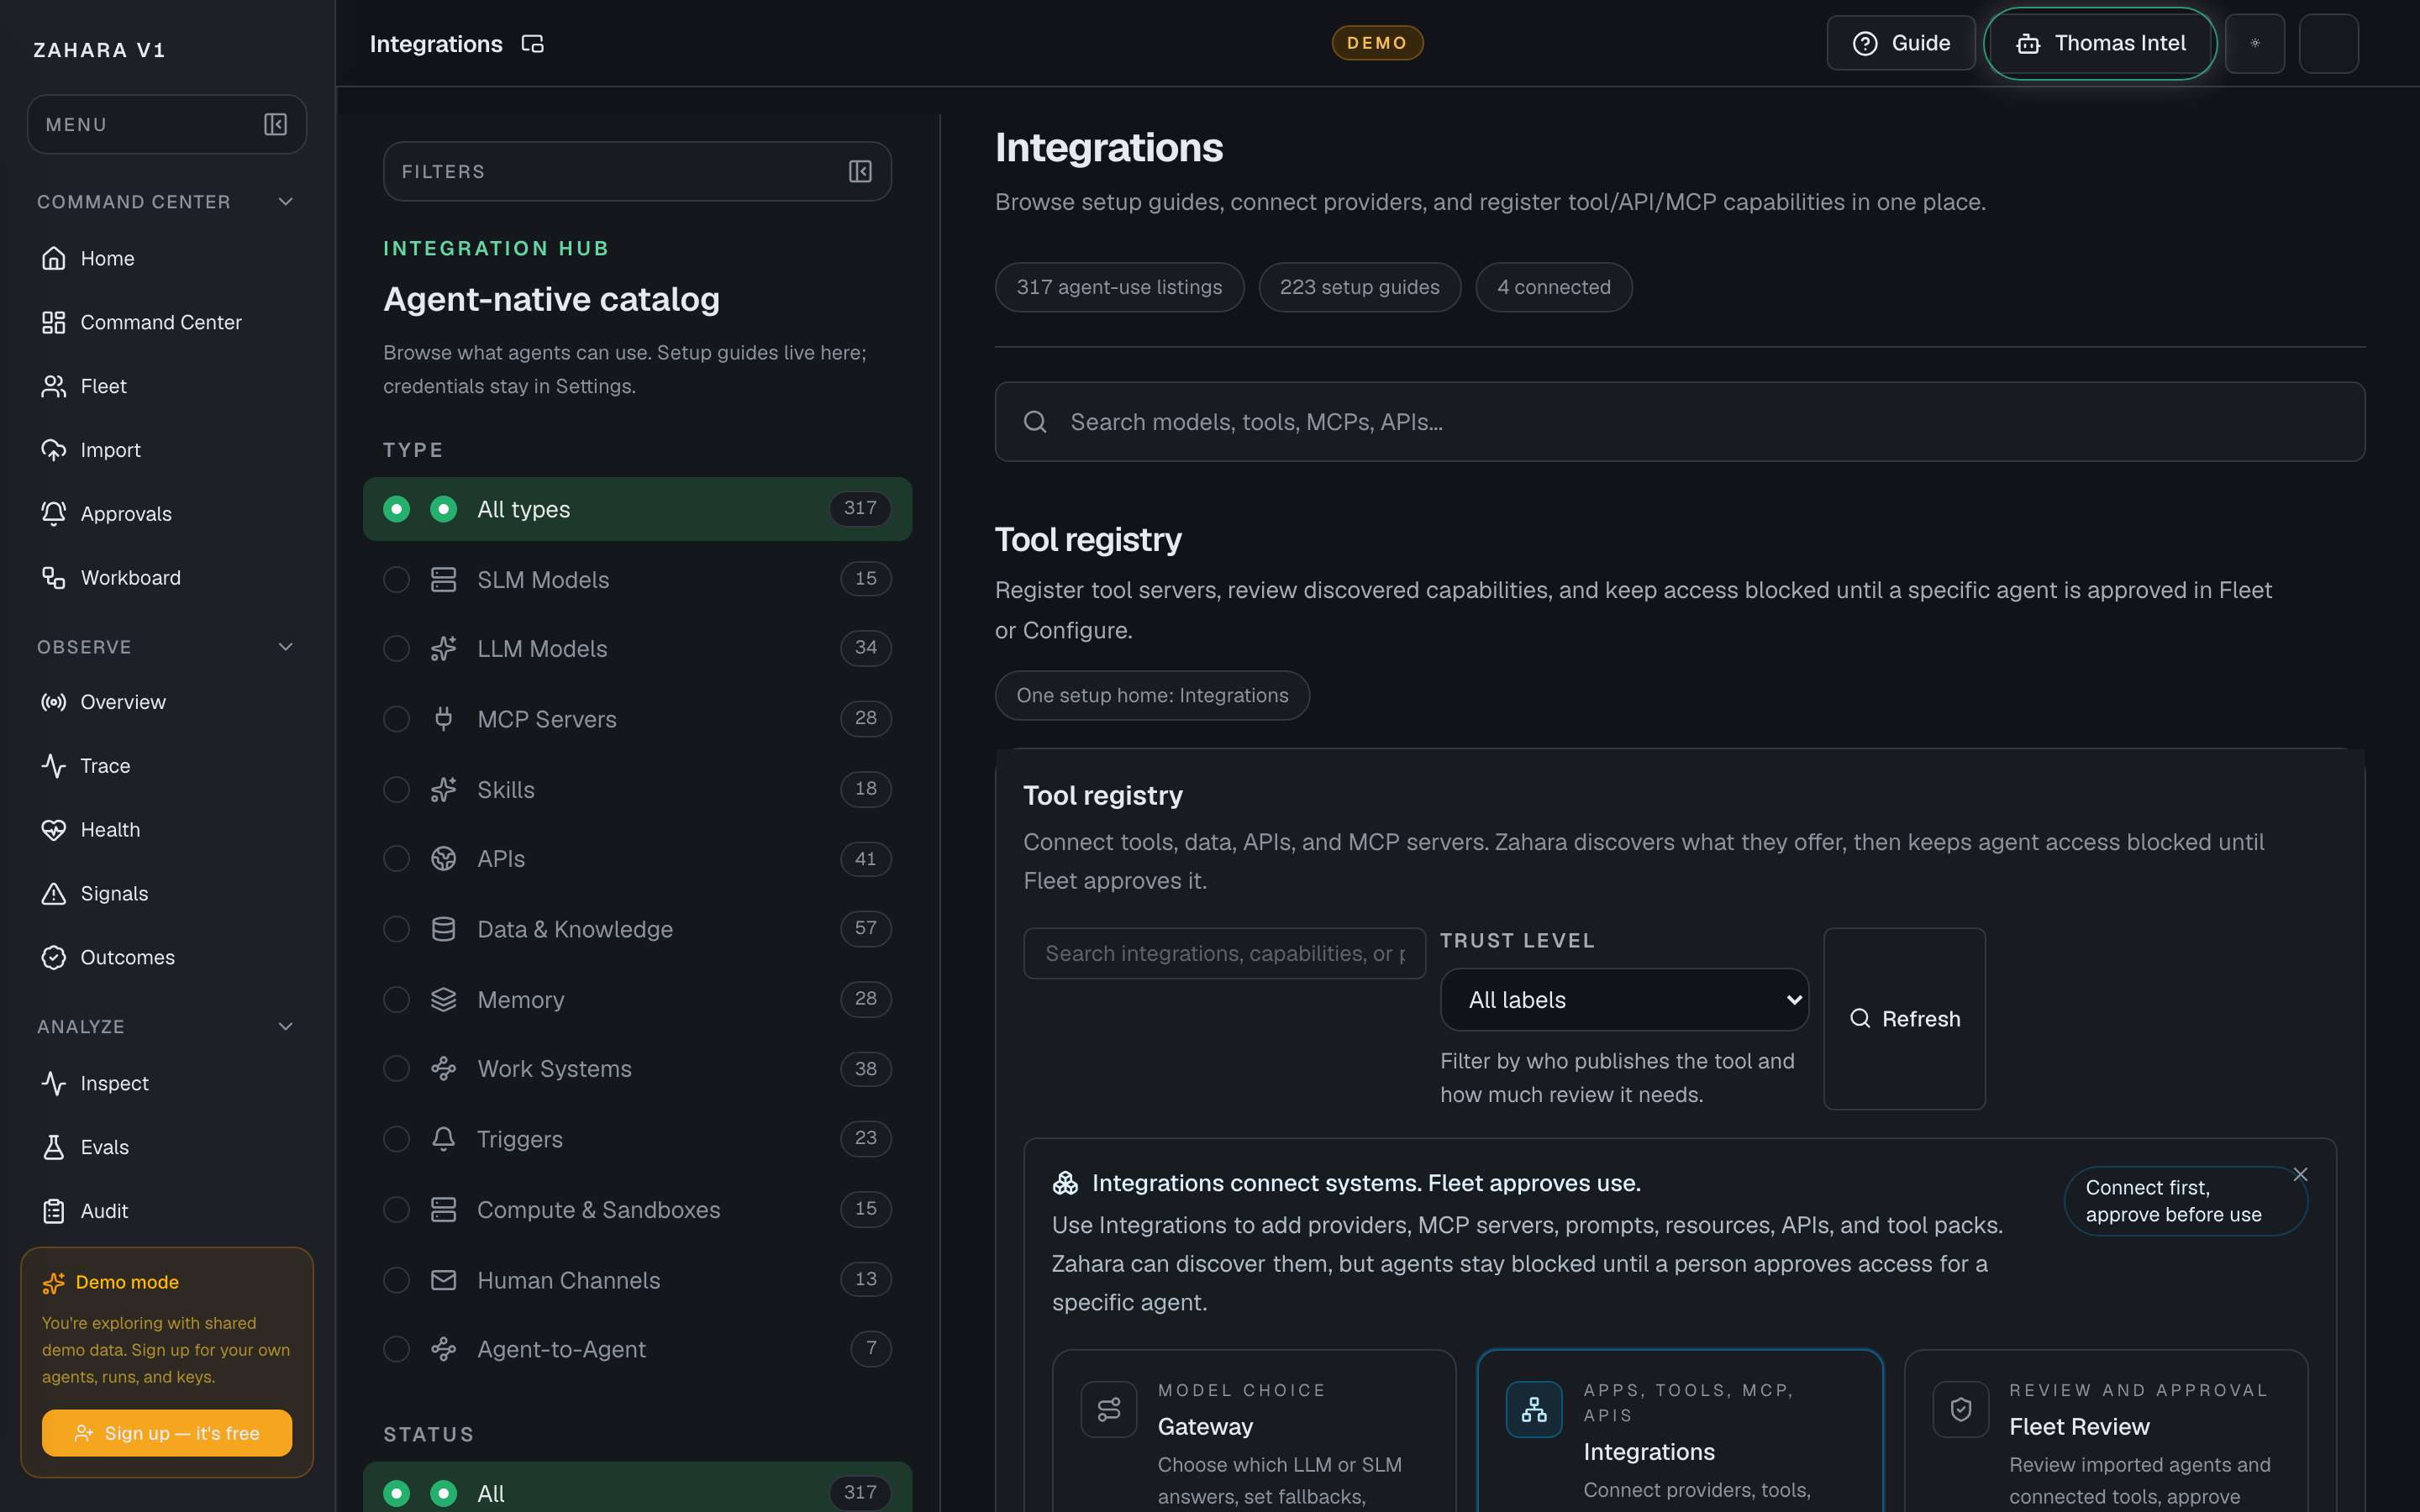
Integration Hub
What it is
Integration Hub is the searchable 417-entry catalog for models, tools, MCP servers, APIs, work systems, data sources, memory stores, compute surfaces, channels, and agent-to-agent protocols your agents can use.
Value to users
It helps users recognize the stack they already use, find setup guides quickly, and keep every connection behind review until a workspace admin approves access.
Use it when
- Choose whether to connect a model, tool, work system, or data source.
- Explain Guide available, Connected, and Coming soon support honestly during demos.
- Show buyers that connecting is only step one: review, budgets, logs, and proof of what ran come next.
- Search a large catalog by product name without scanning all 417 listings.
Next safe action
Search for the system you care about, open the matching card or detail drawer, then connect, open the setup guide, or ask to be notified.
Options and features
| Option | What it does | Value it adds | How to use it |
|---|---|---|---|
| Search | Finds integrations by product name, category, status, or connector path. | Lets a new user get to their existing stack without scanning every category. | Search for a tool like MCP, GitHub, OpenAI, Slack, Gmail, Postman, Terraform Cloud, Tableau, Contentful, or local models. |
| Status filters | Separates Connected, Guide available, and Coming soon integrations. | Keeps the product honest and prevents roadmap items from looking production-ready. | Use Connected for what is already configured, Guide available for setup paths a user can inspect now, and Coming soon for visible roadmap demand. |
| Category filters | Groups integrations by models, MCP servers, skills, APIs, data and knowledge, memory, work systems, triggers, compute, channels, and agent-to-agent surfaces. | Helps users understand what they are connecting without learning internal architecture. | Pick the category that matches the thing you are trying to connect before opening a detail page. |
| Start here | Highlights the shortest credible demo paths. | Gives beta users a fast route to value without needing to understand the whole platform first. | Choose a starter card, read the filtered results, then open the connection drawer. |
| Connection drawer | Explains status, setup path, review steps, and what happens after a connection is requested. | Turns logos into a safe setup flow instead of a decorative checklist. | Open a card before connecting anything risky, then confirm from the drawer. |
| Detail drawer | Shows the integration facts, status, category, credential type, and next action without leaving the catalog. | Lets users inspect the fit and setup path while search and filters stay in place behind the drawer. | Open a card from the results list, read the drawer, then close it to continue searching. |
Basic workflow
- 1Open Integration Hub when a user asks what Zahara connects to.
- 2Search or filter to the system they already use.
- 3Read the status guide so Connected, Guide available, and Coming soon are clear.
- 4Open the matching card and read the detail drawer.
- 5Connect, request preview, or ask to be notified.
- 6Review access before any agent can use the connection.
Proof that it worked
- Search returns the expected card.
- Connected, Guide available, and Coming soon labels are visible.
- The catalog count shows 417 listings.
- Each card opens the drawer.
- Confirming a drawer action shows a toast.
- The copy says agents cannot use a connection until review.
Before you start
- Confirm you are on /integrations and looking at the right workspace.
- Read visible status, warning, or empty-state text before clicking an action.
- If the page shows IDs, copy the relevant agent, run, onboarding, or request ID before switching pages.
If you get blocked
- If the page is empty, check whether filters, scope, or time window are hiding the data.
- If an action is locked, follow the visible lock reason before trying another route.
- If Integration Hub does not answer the question, open the linked evidence page instead of guessing.
Useful Thomas questions
- Based on the visible state, what is the next safe action?
- Which status, warning, or ID should I verify first?
- Which linked evidence page proves this Integration Hub state?
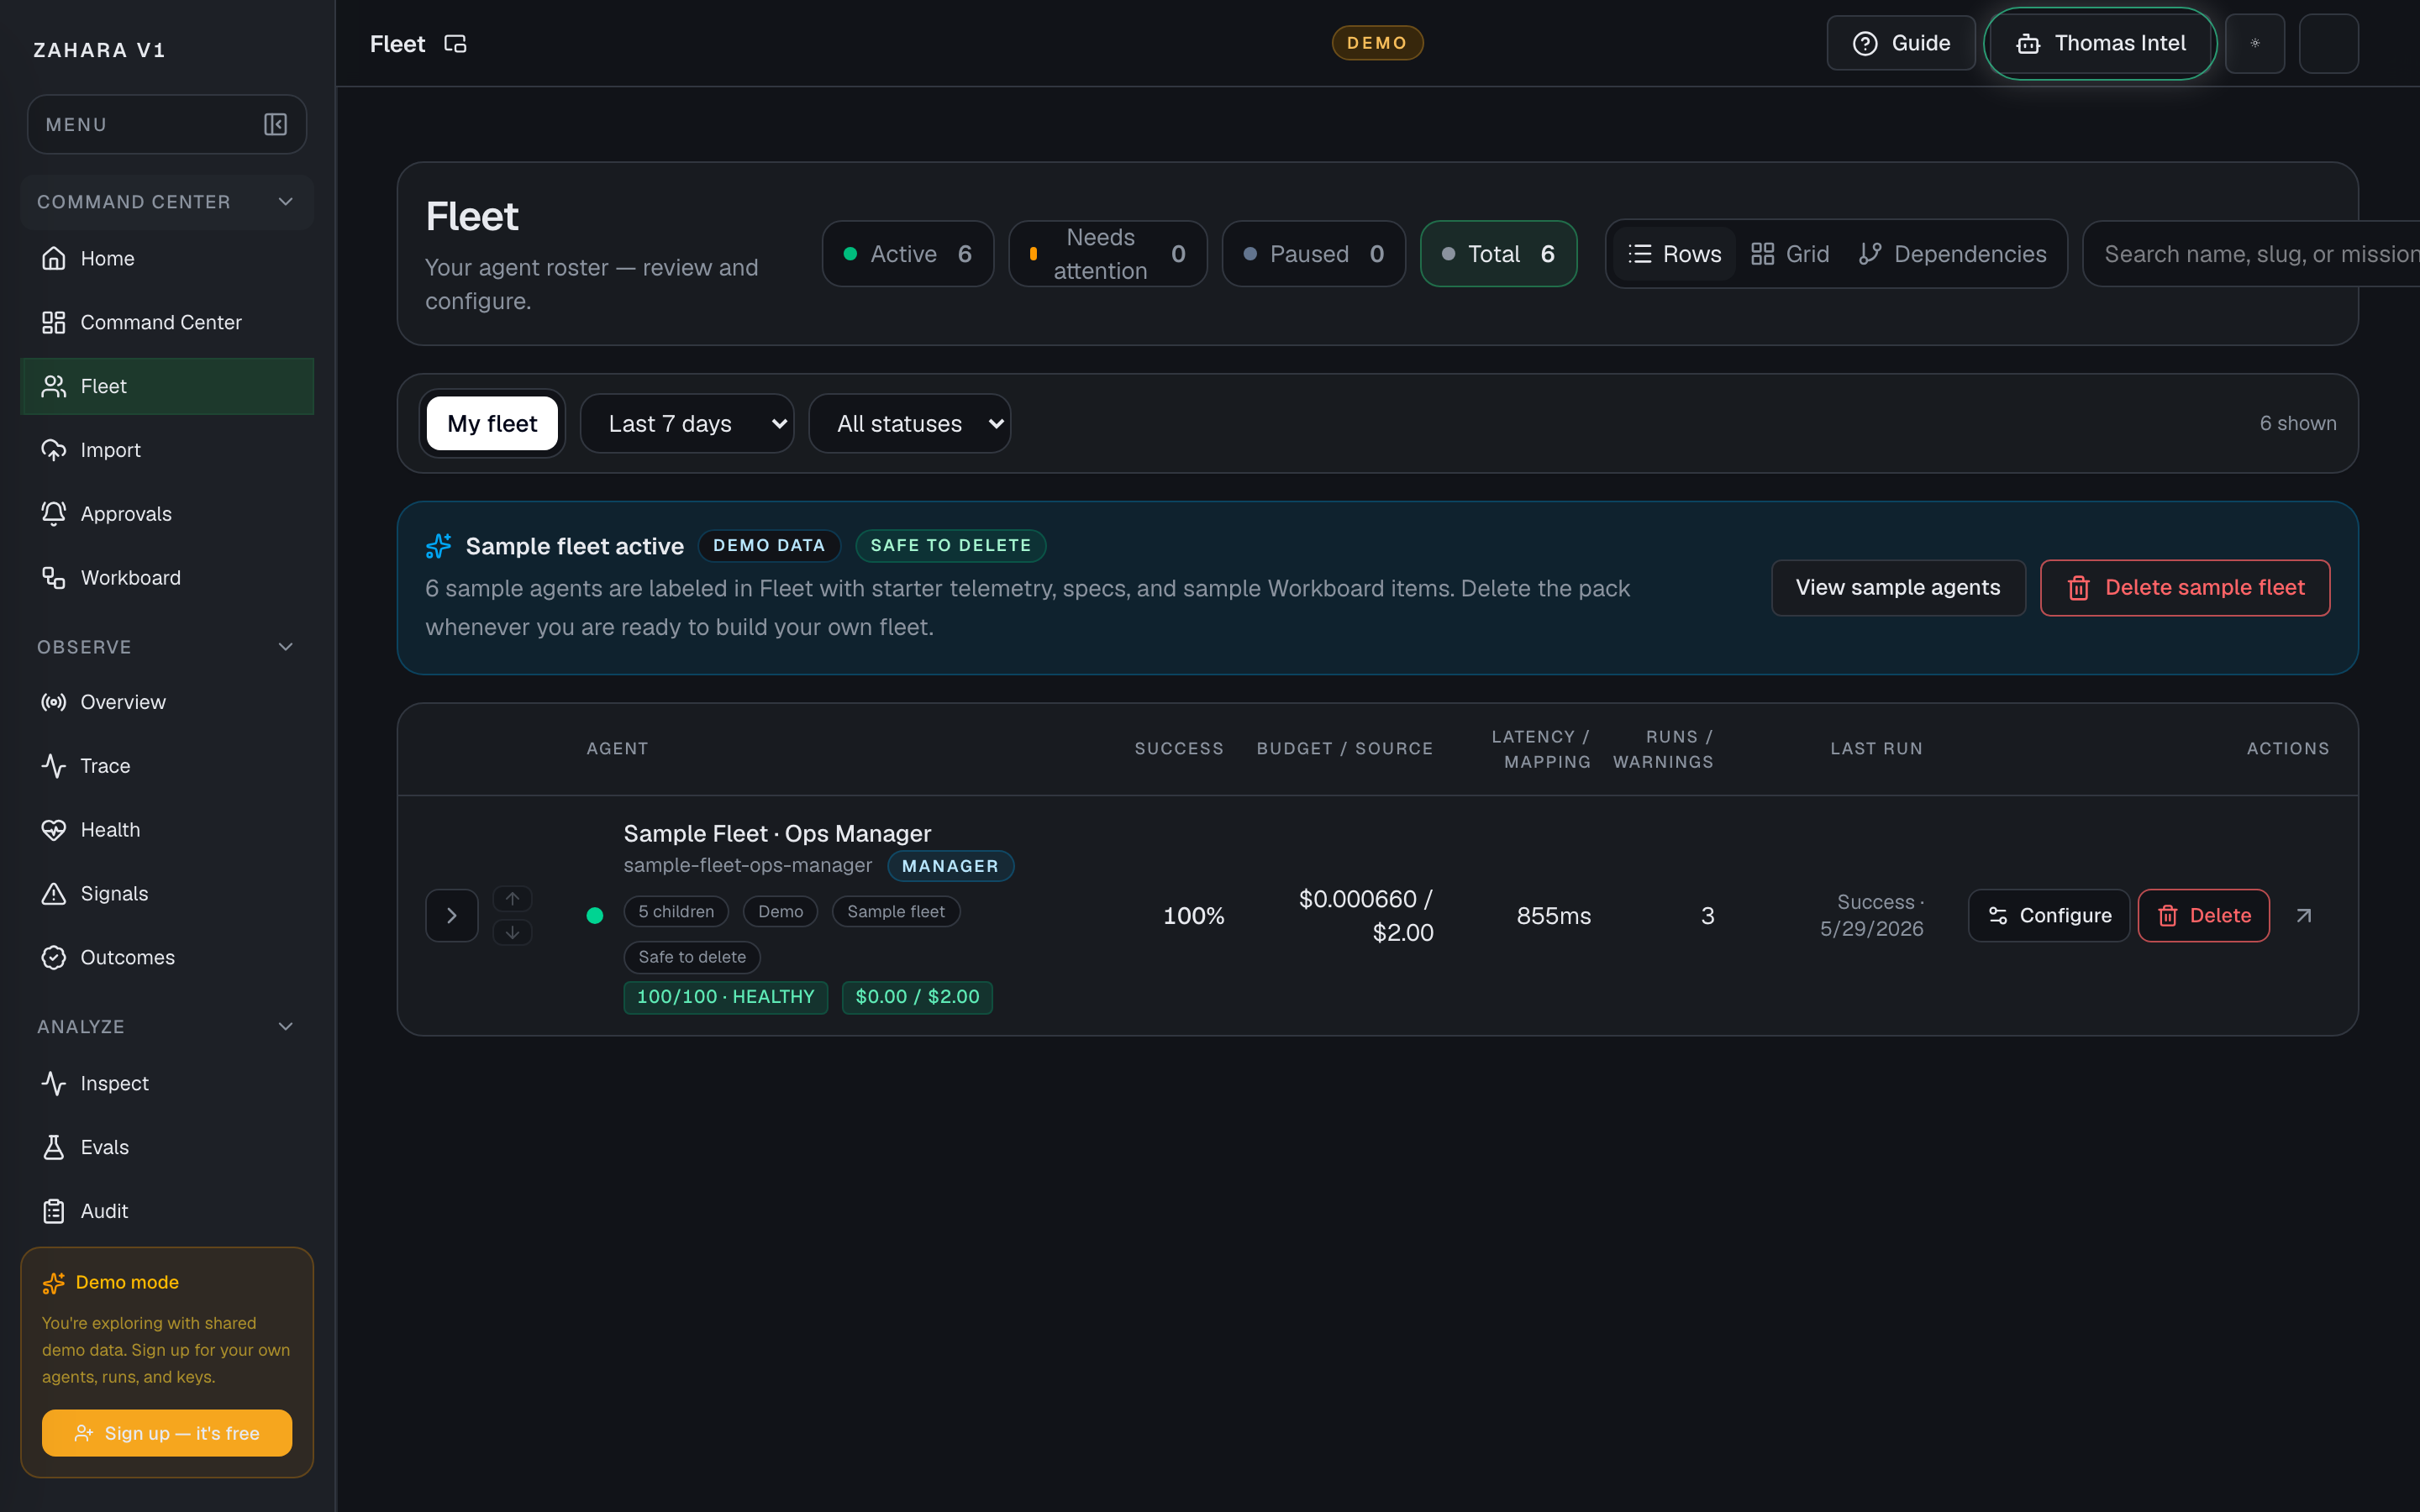
Fleet
What it is
Fleet is the roster of agents in this workspace.
Value to users
It keeps the operational roster clear: which agents exist, what state they are in, whether they need attention, and where to open deeper configuration. Creation, importing, and guided setup live in Studio and Import so Fleet stays focused.
Use it when
- Find an agent quickly by name, slug, status, or owner. A slug is a short URL-safe identifier like support-triage.
- Use Fleet as an agent roster first, not as a dashboard wall.
- Check active, paused, and attention counts before starting work.
- Use Agent GPS from card or row actions when you need to follow one agent into its live run route.
- Expand one row to review controls, team setup, recent activity, and config links.
- Switch to Dependencies when a provider, model, or tool change could affect multiple agents.
- Load or delete the labeled sample fleet when a new user needs safe demo data.
- Seed a manager-owned Workboard queue from an operating pack.
Next safe action
Start with the status pills and search. If this is a new or demo workspace, use the sample fleet or a manager operating pack. Use Agent GPS when the question is what an agent is doing or what it just did. Then open the one agent that needs attention, use the expanded row for controls, or jump to Agent Cockpit for full configuration.
Options and features
| Option | What it does | Value it adds | How to use it |
|---|---|---|---|
| Page pop-out | Launches a read-only Fleet monitor for a second screen from the app header. | Keeps active, paused, and attention states visible while operators work elsewhere. | Use the small pop-out icon beside the page title when Fleet should stay visible. Make changes from the full Fleet page, not the monitor. |
| Customize layout | Lets an operator reorder Fleet monitor cards and reset them to the default order. | Supports second-monitor preferences without changing shared Fleet data or exposing mutation controls. | Use it in `/fleet/live`; changes are saved in this browser only, so each operator station can keep its own wall layout. |
| Rows view | Shows agents in the default row/list roster with columns for status, success, budget/source, latency, and warnings. | Keeps Fleet scannable for real operations instead of turning agent management into another dashboard. | Use Rows as the default view when you need to triage agents. Switch to Grid or Dependencies only for a specific scanning or relationship question. |
| Status pills | Filters the roster by active, attention, paused, or total agents. | Turns the top counts into navigation instead of decoration. | Click a pill to narrow the list, then use Clear filters to return to the full roster. |
| Fleet filters and views | Filters by text, status, time window, scope, row view, grid view, or dependency view. | Helps large workspaces find the right agent or relationship quickly. | Start with search or status. Use grid for scanning cards and Dependencies when shared resources matter. |
| Agent GPS | Opens the selected agent's live GPS route at `/agents/[agentId]/live`, with the latest run selected when Fleet has one. | Moves from roster triage to the run graph, live decision feed, Inspect replay, and Audit proof for that exact agent. | Use Agent GPS from card view or the row Actions column when you need to follow what the agent is doing now or replay what it just did. The destination is the Live Run Console / Agent GPS surface. |
| Expanded row | Opens inline controls for one agent without leaving the roster. | Keeps status, daily cap, manager assignment, recent activity, and configuration links close to the row being reviewed. | Use the chevron at the far left to expand one row. Fleet keeps this lightweight: make small roster changes inline, then open Configure for the full settings surface. |
| Configure button | Opens this agent's rich settings page at `/agents/[id]?tab=configure§ion=identity-brief`. | Makes the deep configuration path explicit instead of hiding it behind row click behavior. | Use Configure when you need Identity Brief, Instructions / Behavior, model policy, runtime limits, tools, approvals, alerts, evals, memory, or source sync. |
| Manager and child agents | Shows manager agents with child counts, child health, and expandable child rows. | Lets teams see when one agent supervises a small team without turning Fleet into a complex org chart. | Expand the manager row to reveal child agents. Open Team setup in the expanded row to attach children, set routing defaults, or open the manager inbox. |
| Sample fleet pack | Adds or removes a labeled sample team with demo agents, starter telemetry, specs, runs, and Workboard items. | Lets a new user see the platform working without mixing demo data into a real fleet. | Use Add sample fleet when the workspace is empty or needs safe examples. Use View sample agents to filter to that pack. Use Delete sample fleet when the user is ready to build their own roster. |
| Manager inbox | Opens the Workboard already filtered to one manager team or to blocked manager work. | Keeps manager-owned queues close to the roster where the manager/child relationship is maintained. | Expand a manager row and use Open manager inbox or Open blocked work. |
| Operating packs | Loads starter desks such as Marketing starter desk, Startup ops starter desk, Founder desk starter queue, or a custom starter desk into Workboard. | Gives manager teams useful first cards for routing, proof, and review instead of an empty board. | Choose a pack in the manager row, save it if needed, then Load starter desk. |
| Reusable pack library | Saves a good starter desk as a personal or workspace reusable pack and lets another manager use or duplicate it. | Turns one good manager setup into a repeatable operating pattern. | Name the pack, choose Personal or Workspace visibility, then Save as reusable pack. |
| Scheduled desk refresh | Auto-seeds a saved reusable pack on a cron cadence while skipping still-open cards. | Keeps recurring manager queues alive without duplicating unfinished work. | Pick a reusable pack, add a schedule label and UTC cron expression, then Save refresh. |
| Routing defaults and rules | Maps manager routing lanes and recurring match phrases to child agents. | Makes common handoffs repeatable while keeping the manager decision visible and editable. | Set lane defaults and phrase rules from the manager row, then verify Workboard suggestions before saving a route. |
| Dependencies | Shows shared providers, models, tools, and cross-agent relationships. | Prevents changing a shared resource without seeing what else it touches. | Switch to Dependencies before changing a provider, model route, or tool used by more than one agent. |
| Open cockpit | Opens the detail page for a specific agent. | Moves from fleet-level management to one-agent proof, status, configuration, observe, and changelog controls. | Click the agent row, use the arrow icon, or open Configure directly when the question is about settings. |
Basic workflow
- 1Scan the status pills to see whether the roster is calm or needs attention.
- 2Stay in Rows view for normal roster triage.
- 3Use search or a status filter to narrow the roster.
- 4Use Agent GPS from the card or row when the next question is what one agent is doing or what it just did.
- 5Use Configure directly when you already know the agent's settings need work.
- 6Use the chevron to expand the row when you want roster-level context first.
- 7Check status, spend cap, team assignment, recent activity, and quick links.
- 8For a demo or new workspace, add the sample fleet or load a manager operating pack before judging whether the product is empty.
- 9For a manager row, open the manager inbox, choose an operating pack, save reusable packs, configure scheduled refresh, and set routing defaults when the team needs repeatable queues.
- 10Save small control changes inline.
- 11Open Agent Cockpit, Configure, Inspect, Audit, Studio, or Dependencies when the next action needs a deeper surface.
Proof that it worked
- Counts match expected scope.
- The page pop-out opens the Fleet wall with active fleet, attention, runtime queue, runner state, and a read-only watch list.
- Customize layout reorders cards locally and Reset layout restores the default order.
- No-run agents show dashes instead of fake zero metrics.
- Rows view is the default Fleet experience and remains the main roster surface.
- Agent GPS buttons open `/agents/[agentId]/live` and do not fall through to the cockpit route.
- Only one row expands at a time.
- Rows have a visible Configure button for the full settings page.
- Expanded rows show operational controls, team setup, recent activity, settings/configuration links, and separated destructive actions.
- Manager rows can expand to show child agents when hierarchy is configured.
- The sample fleet banner shows Demo data and Safe to delete when the pack is active.
- Sample fleet controls include Add sample fleet, View sample agents, and Delete sample fleet.
- Manager rows show manager inbox, blocked work, operating pack, reusable pack library, scheduled desk refresh, and routing default controls when manager context is available.
- Dependencies explains shared-resource impact before the graph appears.
Before you start
- Confirm you are on /agents and looking at the right workspace.
- Read visible status, warning, or empty-state text before clicking an action.
- If the page shows IDs, copy the relevant agent, run, onboarding, or request ID before switching pages.
If you get blocked
- If agents are missing, check search, status pills, time window, and whether sample agents are hidden.
- If an agent shows no runs, open the agent Status page and confirm whether there are truly no runs or telemetry is unavailable.
- If Dependencies shows shared risk, inspect what else could break before changing a provider, model, or tool.
Useful Thomas questions
- Which agent should I inspect first from this Fleet view?
- Why does this agent show Needs attention?
- What else could break if I change this shared provider or tool?
Agent Cockpit
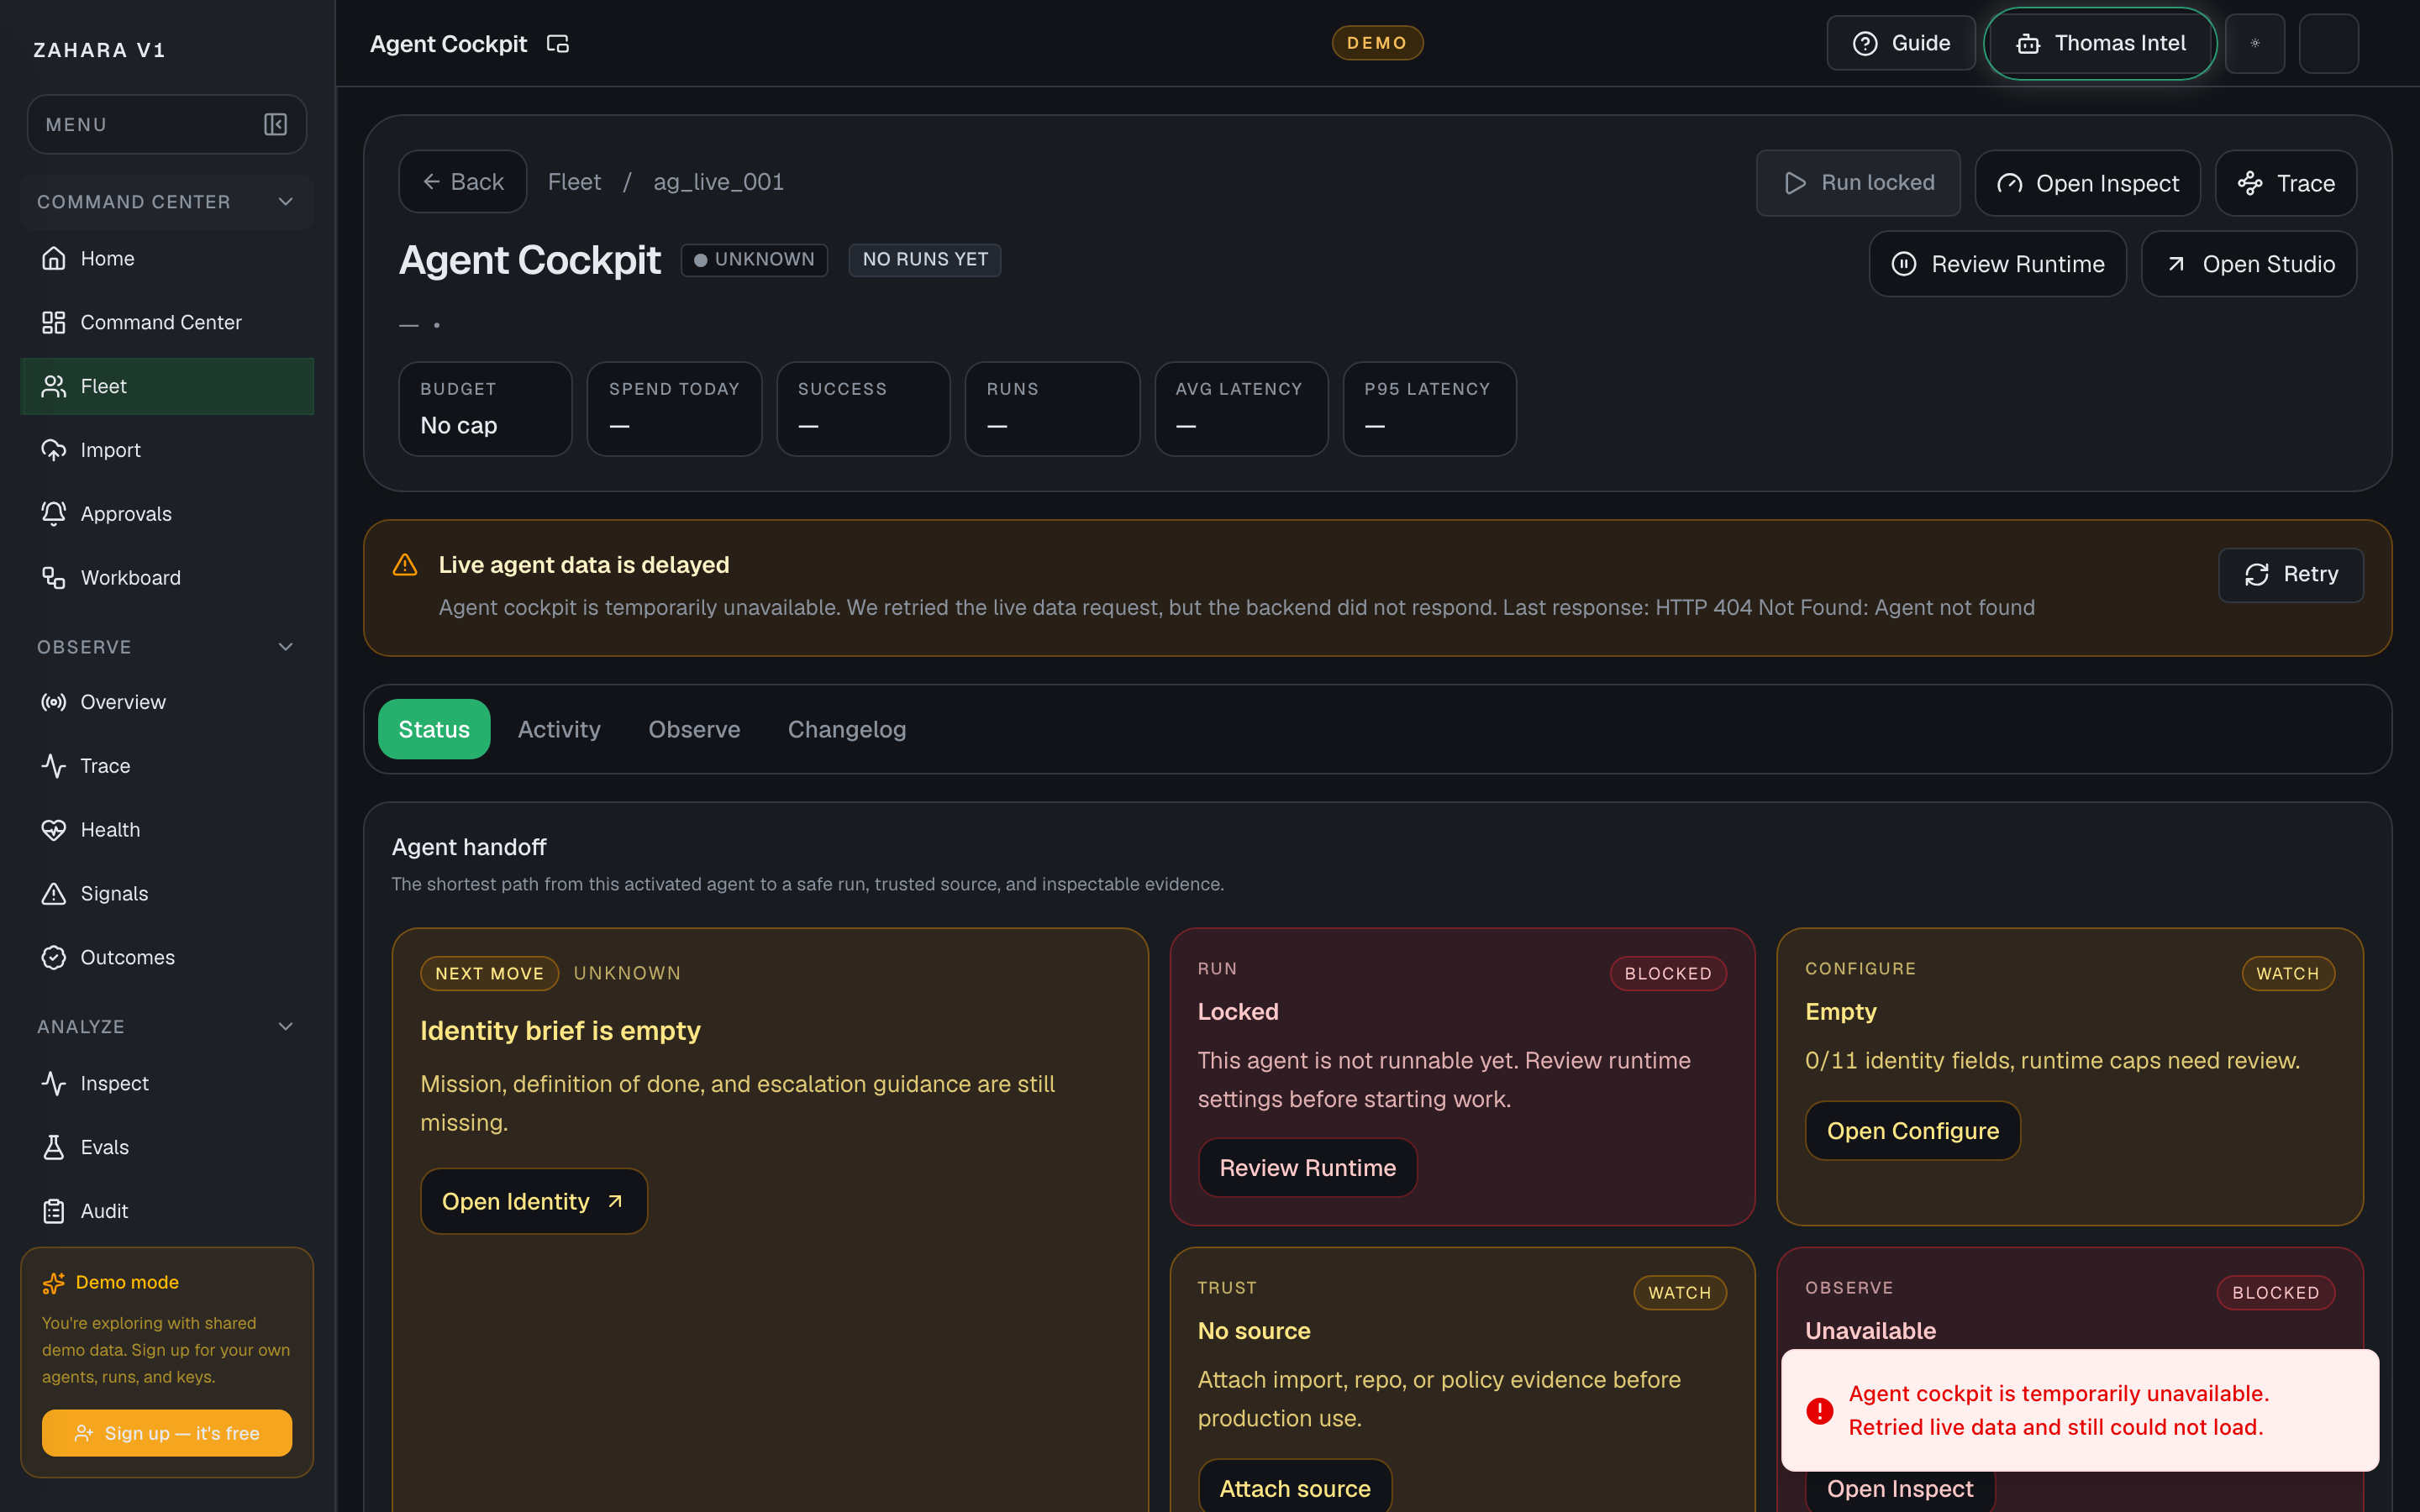
What it is
Agent Cockpit is the detail page for one agent.
Value to users
It collects status, source record, runtime controls, handoff cards, runs, configuration, and audit evidence in one place.
Use it when
- Run a controlled proof test.
- Inspect one agent's source, status, or history.
- Pause, resume, trace, configure, or audit a specific agent.
Next safe action
For a draft or newly imported agent, run one controlled proof test, then inspect the result before trusting it with real work.

Options and features
| Option | What it does | Value it adds | How to use it |
|---|---|---|---|
| Run test | Opens the inline run console for a controlled proof prompt. | Creates evidence before the agent is trusted with real work. | Send one safe prompt, wait until the run finishes, then open Inspect or Trace. |
| Observe tab | Shows the same Observe lane already scoped to this cockpit, including a team rollup when the agent is a manager. | Lets teams judge one child agent or one managed team without leaving cockpit context. | Open Observe after a proof run, when one agent feels noisy, or when a manager needs to compare children before routing more work. |
| Agent handoff | Shows the shortest path from current status to safe operation. | Tells the operator what matters next without reading the entire page. | Follow the card marked READY first, then inspect evidence. |
| Manage controls | Groups runtime, safety, source, observe, and build controls. | Keeps destructive or operational controls visible but governed. | Use runtime controls only when status and proof support the action. |
| Configure tab | Holds the full settings surface for the saved agent spec. | Keeps durable agent changes versioned and reviewable instead of scattered across Fleet, Flow, and Pro. | Open Configure when changing identity, instructions, inputs, model policy, runtime limits, guardrails, triggers, tools, approvals, alerts, evals, memory, or source sync. |
| Imported source panel | Shows adapter, source, raw hash, mapping, warnings, and evidence links when a source record exists. | Proves where an imported agent came from. | Use View evidence to open Audit before trusting imported work. |
Basic workflow
- 1Confirm status is Active, Draft, Paused, or Retired.
- 2Open Configure before running when the agent's purpose, model, tools, safety, or review policy is unclear.
- 3If runnable, send one safe proof prompt.
- 4Open Inspect and Trace from the run console.
- 5Use Audit to confirm run start and terminal events.
- 6Only promote operational use after proof is clean.
Proof that it worked
- Status and run lock state are clear.
- Proof run creates a stable run ID.
- Configure opens with a left rail and section-specific settings.
- Inspect shows latency, cost, tokens, and events.
- Audit shows matching run evidence.
Before you start
- Confirm you are on /agents/ and looking at the right workspace.
- Read visible status, warning, or empty-state text before clicking an action.
- If the page shows IDs, copy the relevant agent, run, onboarding, or request ID before switching pages.
If you get blocked
- If Run test is locked, read the lock reason and fix configuration, credentials, or status first.
- If a run fails, open Inspect before editing prompts.
- If source evidence is missing, open Audit or Configure before trusting the agent.
Useful Thomas questions
- Based on the visible state, what is the next safe action?
- Which status, warning, or ID should I verify first?
- Which linked evidence page proves this Agent Cockpit state?
Agent Status
What it is
Agent Status is the one-agent handoff page: current state, next safe action, run readiness, source trust, recent proof, and high-level performance.
Value to users
It lets an operator decide whether this agent is ready to run, needs configuration, lacks source evidence, or should be inspected before any more work is assigned.
Use it when
- You opened one agent from Fleet and need the shortest safe next move.
- A demo reviewer needs to understand whether the agent is active, draft, paused, or blocked.
- You need recent run, cost, latency, success, and source posture without jumping across Observe, Inspect, and Audit first.
Next safe action
Read Agent handoff first, then follow the strongest card: Run test, Configure, Inspect, Trace, or attach source evidence.
Related Guide pages

Options and features
| Option | What it does | Value it adds | How to use it |
|---|---|---|---|
| Agent handoff | Names the next move for this agent and explains why that move is safe. | Prevents operators from randomly clicking Configure, Observe, or Run before checking status. | Start here on every agent detail page, especially after import or after a failed run. |
| Manage controls | Groups runtime, safety, source, observe, and build controls into one guarded row. | Keeps live controls visible while still explaining why an action is locked. | Use Run test only when Runnable is visible. Use Runtime or Configure when the page says the run is locked. |
| Performance cards | Summarize status, budget, success, run count, average latency, and P95 latency. | Gives a quick health read before a deeper Observe or Inspect pass. | Use these cards to decide whether the agent needs a proof run, a config edit, or no action. |
| Page pop-out | Launches a read-only Agent Live Monitor for this one agent in a second browser window from the app header. | Keeps the agent's status, runs, eval posture, cost, latency, and audit heartbeat visible while operators work elsewhere. | Use the small pop-out icon beside the page title for active demo agents, critical production agents, or any agent that needs always-on watch without exposing mutation controls. |
| Customize layout | Lets each browser reorder the Agent Live Monitor cards and reset back to the default one-agent wall. | Supports per-agent monitor stations where one screen may prioritize metrics, another may prioritize operator watch items, and another may prioritize run/audit evidence. | Open `/agents/[agentId]/live`, choose Customize layout, move cards up or down, and use Reset layout when this station should return to the default. |
| Recent run preview | Shows the latest execution signal without leaving Status. | Lets a reviewer verify that there is real evidence behind the headline state. | Open Inspect or Trace from the latest run when the preview shows failure, latency, or missing proof. |
| Import source record | Shows preserved source, mapping status, warnings, hashes, and evidence links when this agent came from Import. | Keeps source trust attached to the operational decision. | Open Audit evidence before trusting imported instructions or tools. |
Basic workflow
- 1Confirm the status pill and run lock state.
- 2Read Agent handoff and Manage controls.
- 3If the page says Runnable, run one proof test before trusting real work.
- 4If source evidence is missing, open Configure or Audit before running.
- 5If a recent run exists, open Inspect or Trace for the exact evidence.
- 6Use the page-title pop-out when this agent should stay visible on another screen.
- 7Use Customize layout in the Agent Live Monitor when this station needs a different order.
Proof that it worked
- Status pill, version chip, and primary next move are visible.
- Manage controls explain whether Runtime is runnable or locked.
- Recent run preview distinguishes no runs, loaded runs, and unavailable history.
- Performance cards show budget, success, run count, and latency posture.
- The page pop-out opens `/agents/[agentId]/live` as a read-only wall view with auto-refresh.
- Customize layout reorders Agent Live Monitor cards locally and Reset layout restores the default order.
- Source evidence links to Audit or Configure when available.
Before you start
- Confirm you are on /agents/ and looking at the right workspace.
- Read visible status, warning, or empty-state text before clicking an action.
- If the page shows IDs, copy the relevant agent, run, onboarding, or request ID before switching pages.
If you get blocked
- If the page is empty, check whether filters, scope, or time window are hiding the data.
- If an action is locked, follow the visible lock reason before trying another route.
- If Agent Status does not answer the question, open the linked evidence page instead of guessing.
Useful Thomas questions
- Based on the visible state, what is the next safe action?
- Which status, warning, or ID should I verify first?
- Which linked evidence page proves this Agent Status state?
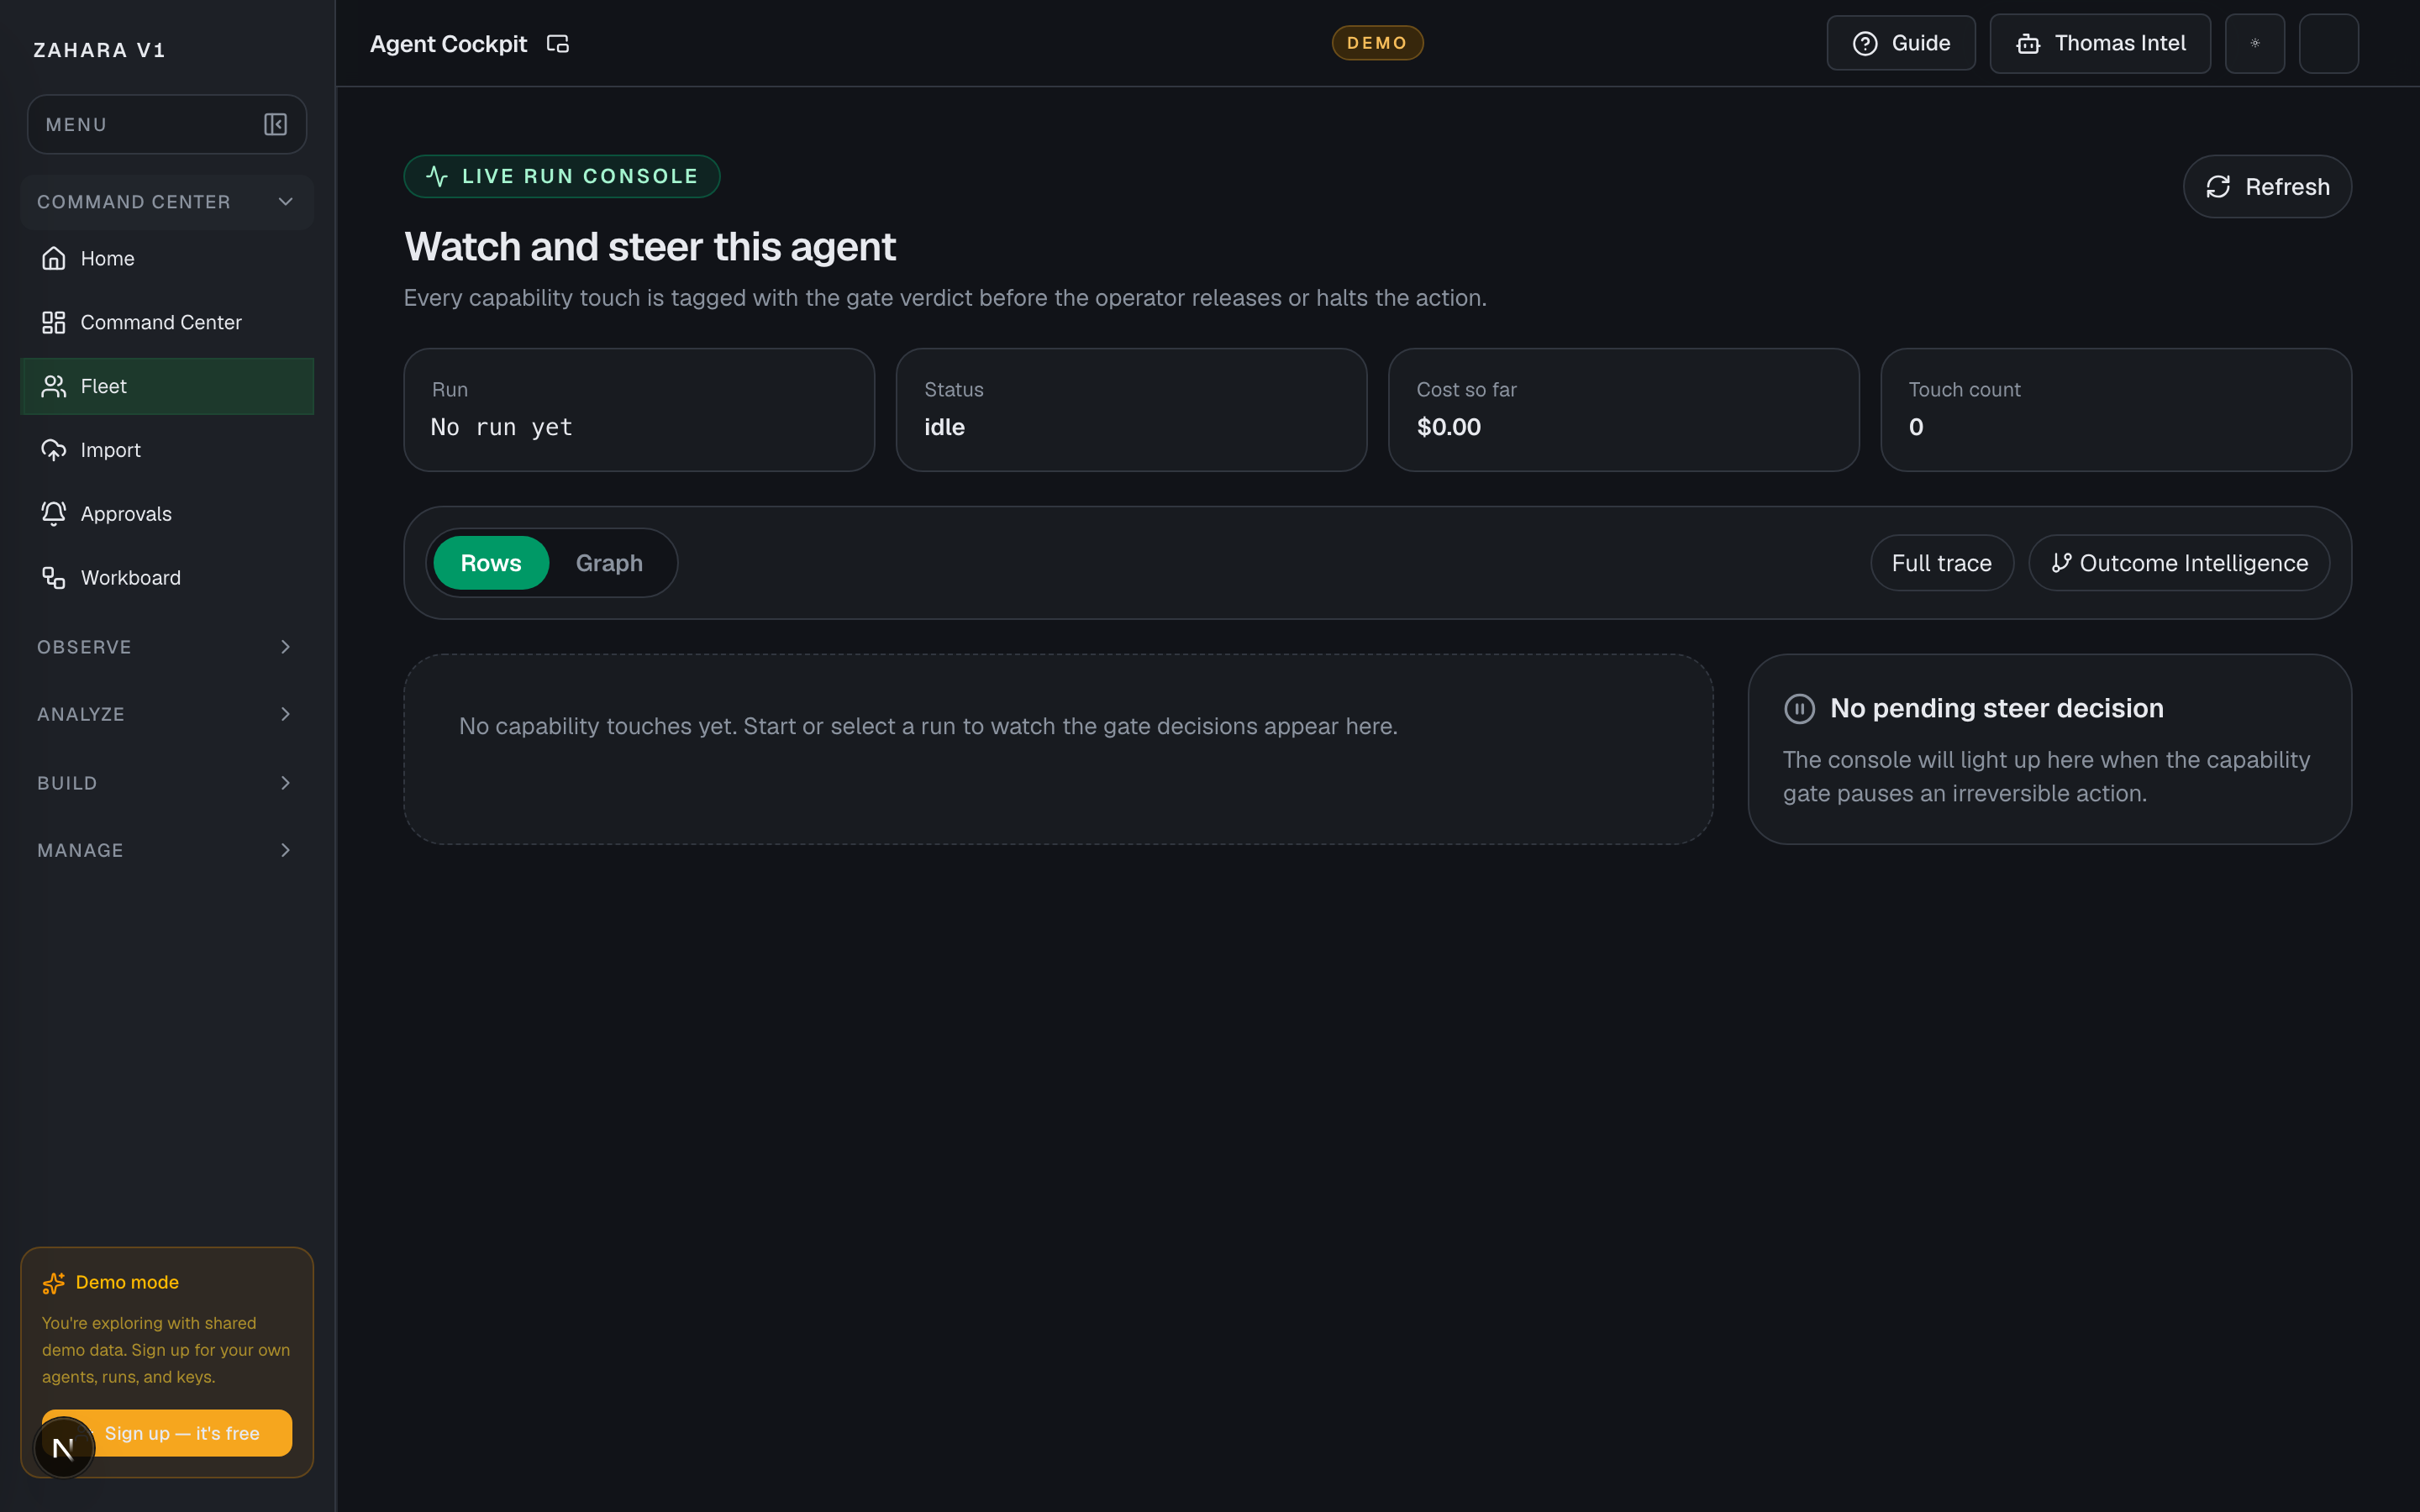
Agent Live Console
What it is
Agent Live Console, also reached from Fleet as Agent GPS, is the one-agent live steering surface for watching capability touches, gate verdicts, paused decisions, and proof links as a run unfolds.
Value to users
It makes the safety promise visible in real time: operators can see what the agent is trying to touch, whether Zahara allowed it, whether human review is required, and where to inspect the proof afterward.
Use it when
- You are demoing a live agent and need visible motion.
- A capability touch paused for human review.
- You need to show Rows, the Agent GPS graph, Full trace, and Outcome Intelligence as one live story.
Next safe action
Start with Rows for the decision feed. Switch to the Agent GPS graph when the user needs a visual map, then open Full trace or Outcome Intelligence for proof.
Related Guide pages
Options and features
| Option | What it does | Value it adds | How to use it |
|---|---|---|---|
| Rows view | Shows live capability touches in chronological order with verdict chips. | Best for reviewing the exact decision sequence. | Use Rows when an operator needs to approve, reject, or explain a paused touch. |
| Agent GPS graph | Shows the run as a radial touch map inside the Live Run Console. | Best for demos because it makes the agent's live motion easy to understand quickly. | Use the Graph toggle after a few touches exist or when explaining the run shape. Fleet's Agent GPS button lands on this same live-run surface. |
| Steer panel | Shows the pending action when a capability gate pauses an irreversible or review-required touch. | Keeps approve/reject decisions close to the live run instead of hiding them in another queue. | Add an optional note, then approve or reject only after the reason and evidence are clear. |
| Proof links | Links the live run to Full trace and Outcome Intelligence. | Turns live motion into after-the-fact evidence. | Use Full trace for replay and Outcome Intelligence for accepted/corrected/denied outcome quality. |
Basic workflow
- 1Open an agent's Live page.
- 2Select Rows for the decision feed or the Agent GPS graph for the radial touch map.
- 3Watch capability touches appear with allowed, approval-required, or denied verdicts.
- 4When an action pauses, read the reason, add an optional note, then approve or reject.
- 5Open Full trace for replay or Outcome Intelligence for trust metrics after the run.
Proof that it worked
- The page header says Live Run Console.
- Rows and Graph toggles are visible; Graph is the Agent GPS visual map.
- Status, cost so far, and touch count cards render.
- Capability touches appear with gate verdicts when a run is active.
- A pending steer decision can be approved or rejected with `decision_source=live`.
- Full trace and Outcome Intelligence links are visible.
Before you start
- Confirm you are on /agents/[agentId]/live and looking at the right workspace.
- Read visible status, warning, or empty-state text before clicking an action.
- If the page shows IDs, copy the relevant agent, run, onboarding, or request ID before switching pages.
If you get blocked
- If the page is empty, check whether filters, scope, or time window are hiding the data.
- If an action is locked, follow the visible lock reason before trying another route.
- If Agent Live Console does not answer the question, open the linked evidence page instead of guessing.
Useful Thomas questions
- Based on the visible state, what is the next safe action?
- Which status, warning, or ID should I verify first?
- Which linked evidence page proves this Agent Live Console state?
Agent Configure
What it is
Agent Configure is the governance editor for one saved agent spec: identity, instructions, inputs and outputs, model policy, safety, runtime, triggers, skills, approvals, alerts, evals, memory, and source sync.
Value to users
It keeps high-impact policy edits in one versioned surface so Flow can show summaries and Pro can serialize the same spec without making every canvas block editable.
Use it when
- You need to change what the agent is, what it can use, how it starts, or when it must ask a human.
- A Flow banner links here because the field is Configure-owned.
- You are preparing an agent for demo and need to verify all governance sections before running it.
Next safe action
Start with Identity Brief if the agent's purpose is unclear. Otherwise pick the left-rail section that matches the policy you need, save the draft, then use Status, Flow, or Pro to verify the saved spec is reflected elsewhere.
Related Guide pages
Options and features
| Option | What it does | Value it adds | How to use it |
|---|---|---|---|
| Identity Brief | Defines mission, audience, jurisdiction, tone, values, risk posture, definition of done, escalation, and memory intent. | Gives reviewers and Thomas a plain-language brief before reading lower-level settings. | Use this first when the agent's purpose or operating boundary is unclear. |
| Instructions / Behavior | Stores system instructions, role instructions, behavior rules, tone, output format, refusal rules, escalation, examples, and test prompts. | Feeds the compiled prompt preview shown in Flow's Agent node. | Edit here when the agent says the wrong thing or needs a clearer behavioral contract. |
| Inputs & Outputs | Defines accepted inputs, output contract, examples, required context, validation rules, destination, failure behavior, and max input characters. | Keeps handoffs predictable before an agent runs or writes somewhere important. | Use it before connecting the agent to external work, sinks, or downstream tools. |
| Model Policy | Controls provider, model, response format, reasoning effort, verbosity, streaming, stop sequences, routing strategy, and fallback model. | Keeps model choice, quality posture, and fallback behavior explicit before cost or reliability surprises appear. | Use this when the agent is too slow, too expensive, using the wrong model, or needs a safer fallback route. |
| Runtime and Reflection | Controls timeout, max steps, max duration, retry behavior, and reflection loop settings. | Prevents runaway runs while showing whether self-check/reflection behavior is enabled. | Set conservative caps before demos and widen only when proof shows the agent needs more room. |
| Guardrails and Safety | Controls moderation, PII posture, blocked behavior, escalation framing, and related safety notes. | Explains the agent-level safety layer that still applies when Flow node guardrails are adjusted. | Use this before disabling a node-level check or allowing sensitive inputs. |
| Triggers & Intake | Defines whether the agent starts manually, from a webhook, schedule, queue, A2A task, AG-UI session, ACP server request, or ANP network call. | Keeps start conditions, protocol endpoints, auth references, discovery metadata, cron, timezone, and scheduled run input in the same source of truth the runner reads. | Use this before showing scheduled, webhook, A2A, AG-UI, ACP, or ANP runs, then confirm Flow Start node reflects the same trigger. |
| Tools & Skills | Defines enabled skills and allowed integrations/MCPs for this agent. | Makes tool access deliberate instead of letting Flow or runtime expose capabilities ad hoc. | Use this when a Tool node picker is empty, greyed out, or needs another approved capability. |
| Human Review / Approvals | Defines reviewer defaults, approval triggers, timeouts, expiry behavior, and escalation chain. | Keeps human-in-the-loop decisions explicit before agents act on high-risk work. | Use this when an action should pause, ask an operator, or escalate instead of auto-running. |
| Alerts | Defines alert thresholds for success rate, budget usage, latency, failed runs, and paused approvals. | Turns runtime drift into an operator-visible signal before a customer reports it. | Use this when the Command Center or Flow lifecycle strip should warn earlier or quieter. |
| Quality / Evals | Defines success criteria, eval cases, pass threshold, frequency, regression policy, release gate, and self-improvement settings. | Connects evaluation, release safety, and learning behavior to the saved agent spec. | Use this before publishing risky edits or enabling self-improvement loops. |
| Knowledge & Memory | Defines sources, retrieval mode, citations, freshness, relationship map, missing-source behavior, and memory retention. | Makes retrieval and memory policy visible wherever Knowledge blocks or long-running agents depend on it. | Use this when answers cite weak sources, miss context, or need stricter memory retention. |
| GitHub Source Sync | Defines repository, base branch, and repo path for source-controlled agent sync. | Keeps code-backed or repo-backed agents tied to inspectable source instead of a loose UI draft. | Use this when the agent should stay aligned with a GitHub source of truth. |
Basic workflow
- 1Open Configure from Fleet, Status, Flow, Pro, or a deep link.
- 2Start with Identity Brief for mission, audience, authority, tone, escalation, memory intent, and definition of done.
- 3Use Instructions / Behavior when the agent's actual answers need to change.
- 4Use Model Policy, Runtime, Guardrails, Tools, and Human Review for execution safety.
- 5Use Alerts, Quality / Evals, Knowledge / Memory, and GitHub Source Sync to keep the agent maintainable after launch.
- 6Choose the exact section in the left rail.
- 7Read the helper copy and current saved values before editing.
- 8Save the section and wait for confirmation.
- 9Switch to Status, Flow, or Pro to verify the same policy is reflected there.
Proof that it worked
- The Configure rail highlights the selected section from the URL.
- Each section explains what is saved and why it matters.
- Saving writes a new draft spec instead of silently changing a signed live snapshot.
- Flow policy banners and Pro agent.yaml reflect the saved Configure-owned fields.
- Deep links use `/agents/[id]?tab=configure§ion=...`.
Before you start
- Confirm you are on /agents/ and looking at the right workspace.
- Read visible status, warning, or empty-state text before clicking an action.
- If the page shows IDs, copy the relevant agent, run, onboarding, or request ID before switching pages.
If you get blocked
- If the page is empty, check whether filters, scope, or time window are hiding the data.
- If an action is locked, follow the visible lock reason before trying another route.
- If Agent Configure does not answer the question, open the linked evidence page instead of guessing.
Useful Thomas questions
- Based on the visible state, what is the next safe action?
- Which status, warning, or ID should I verify first?
- Which linked evidence page proves this Agent Configure state?
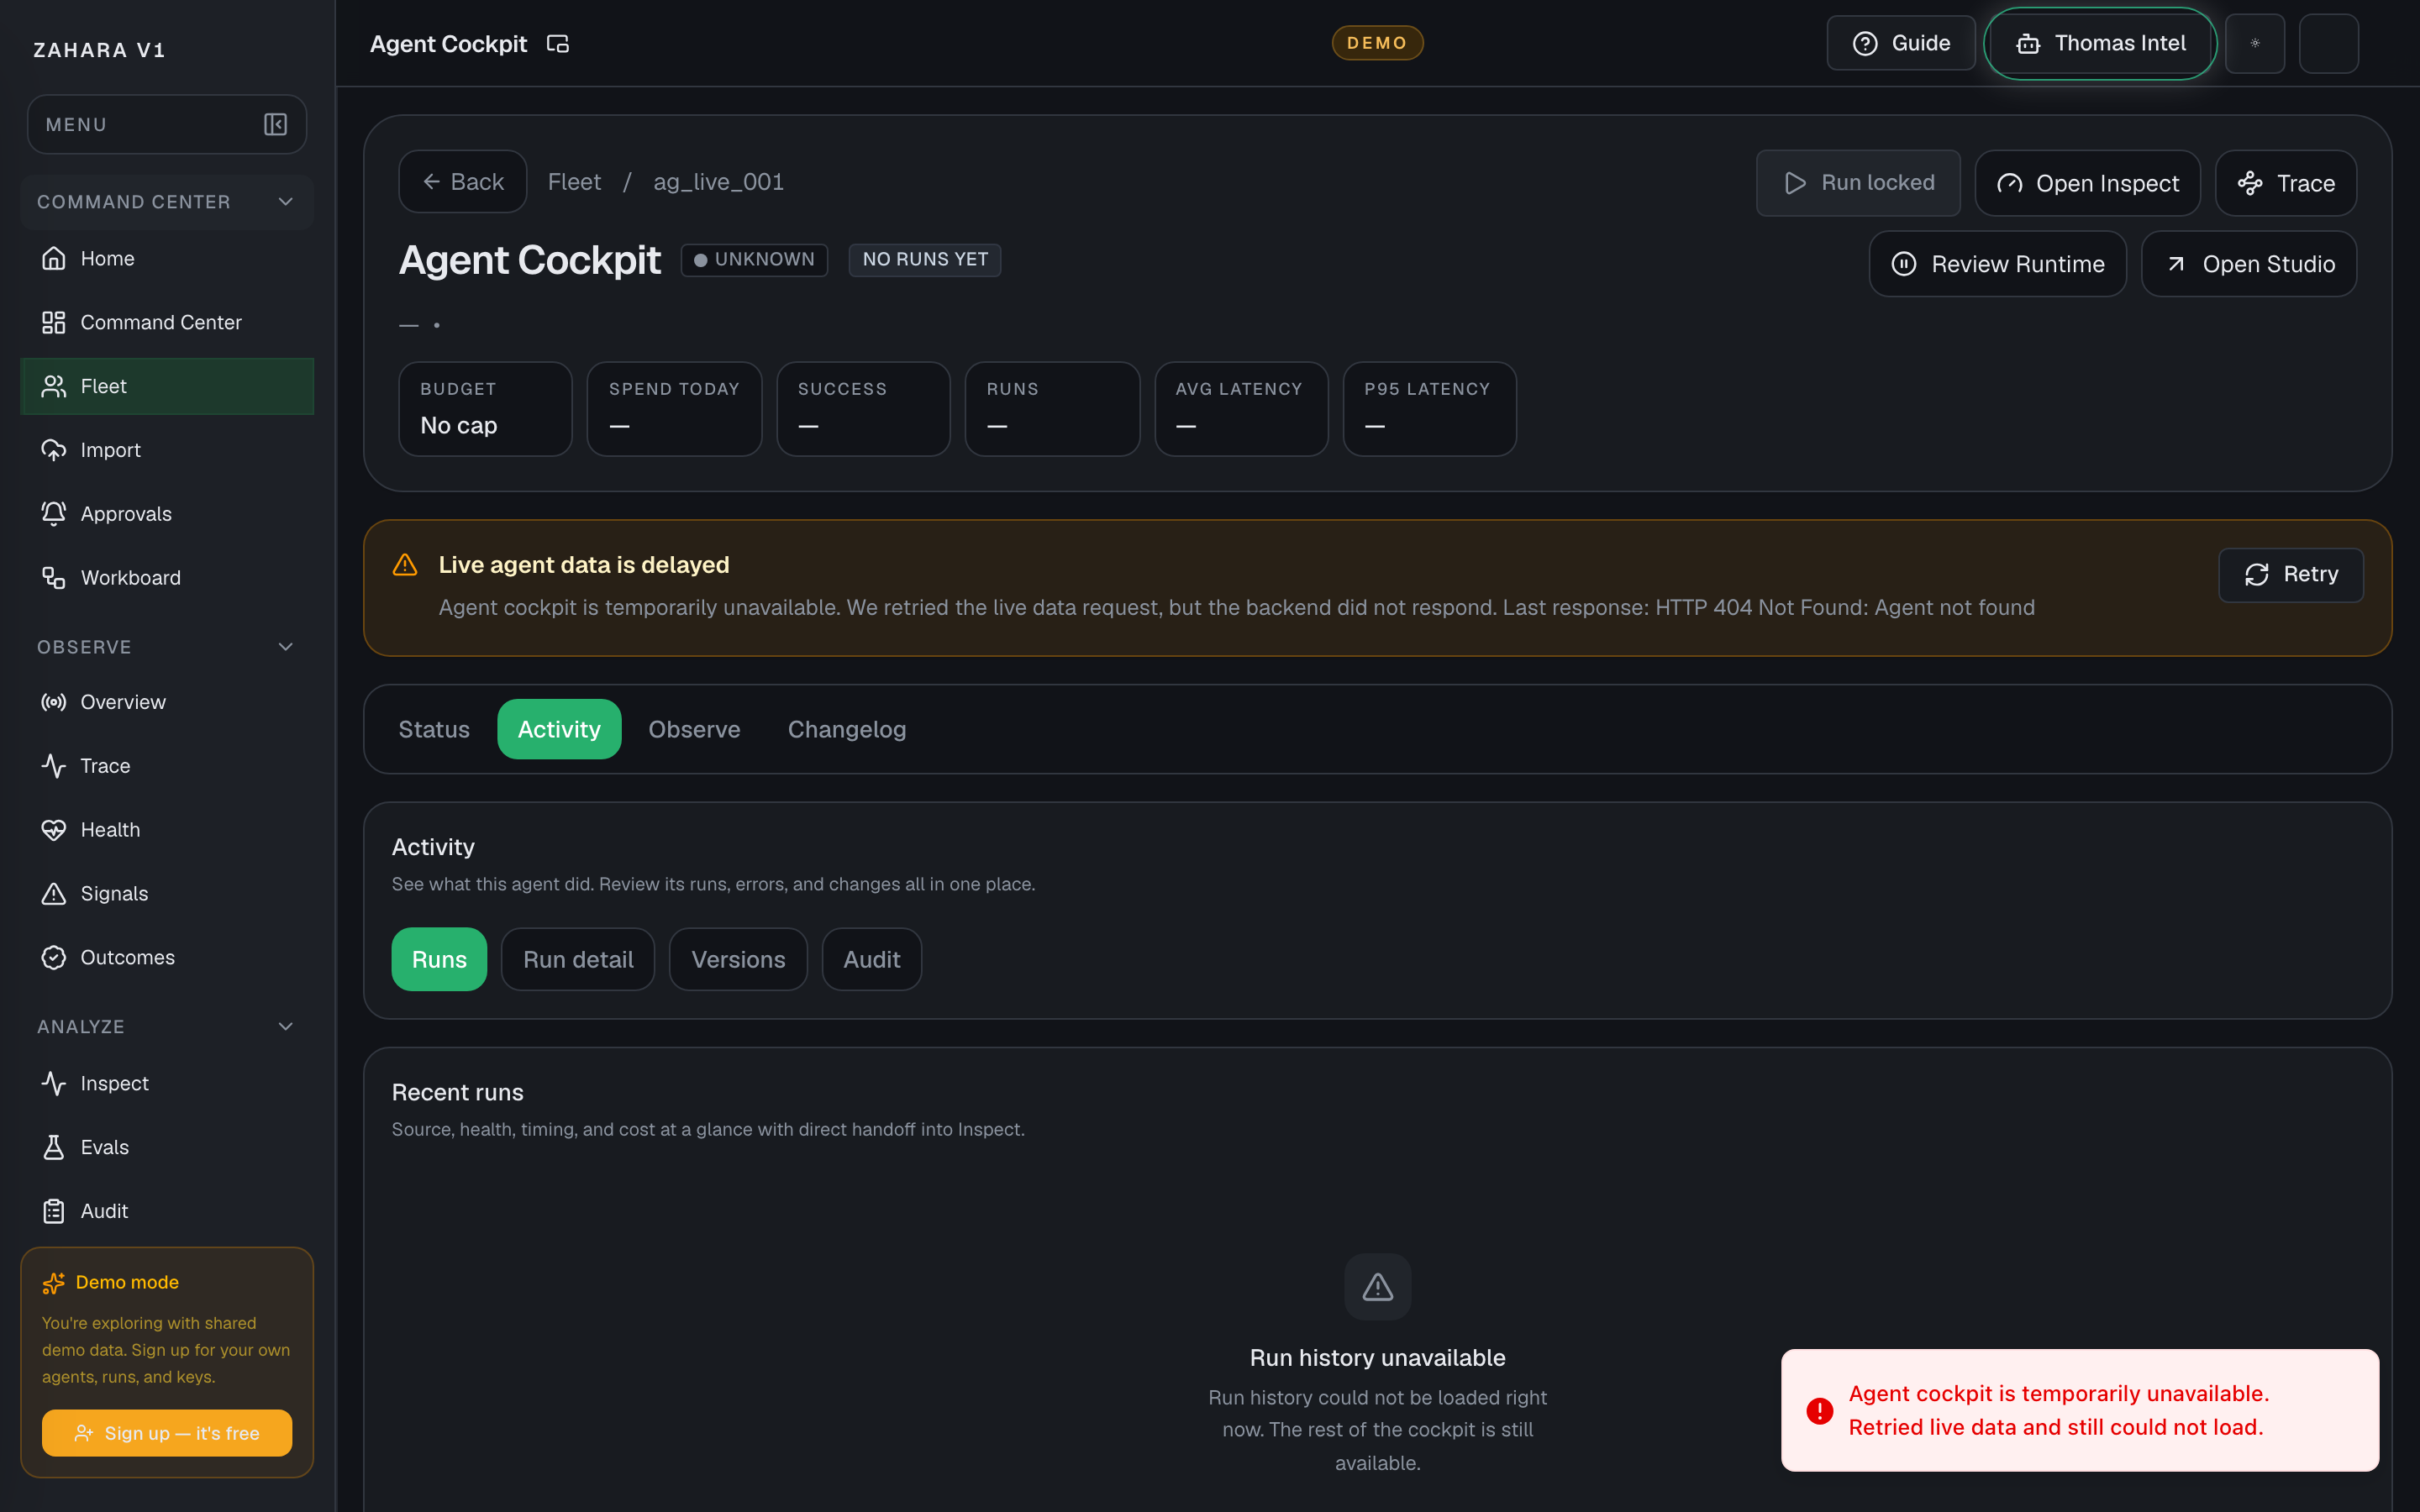
Agent Activity
What it is
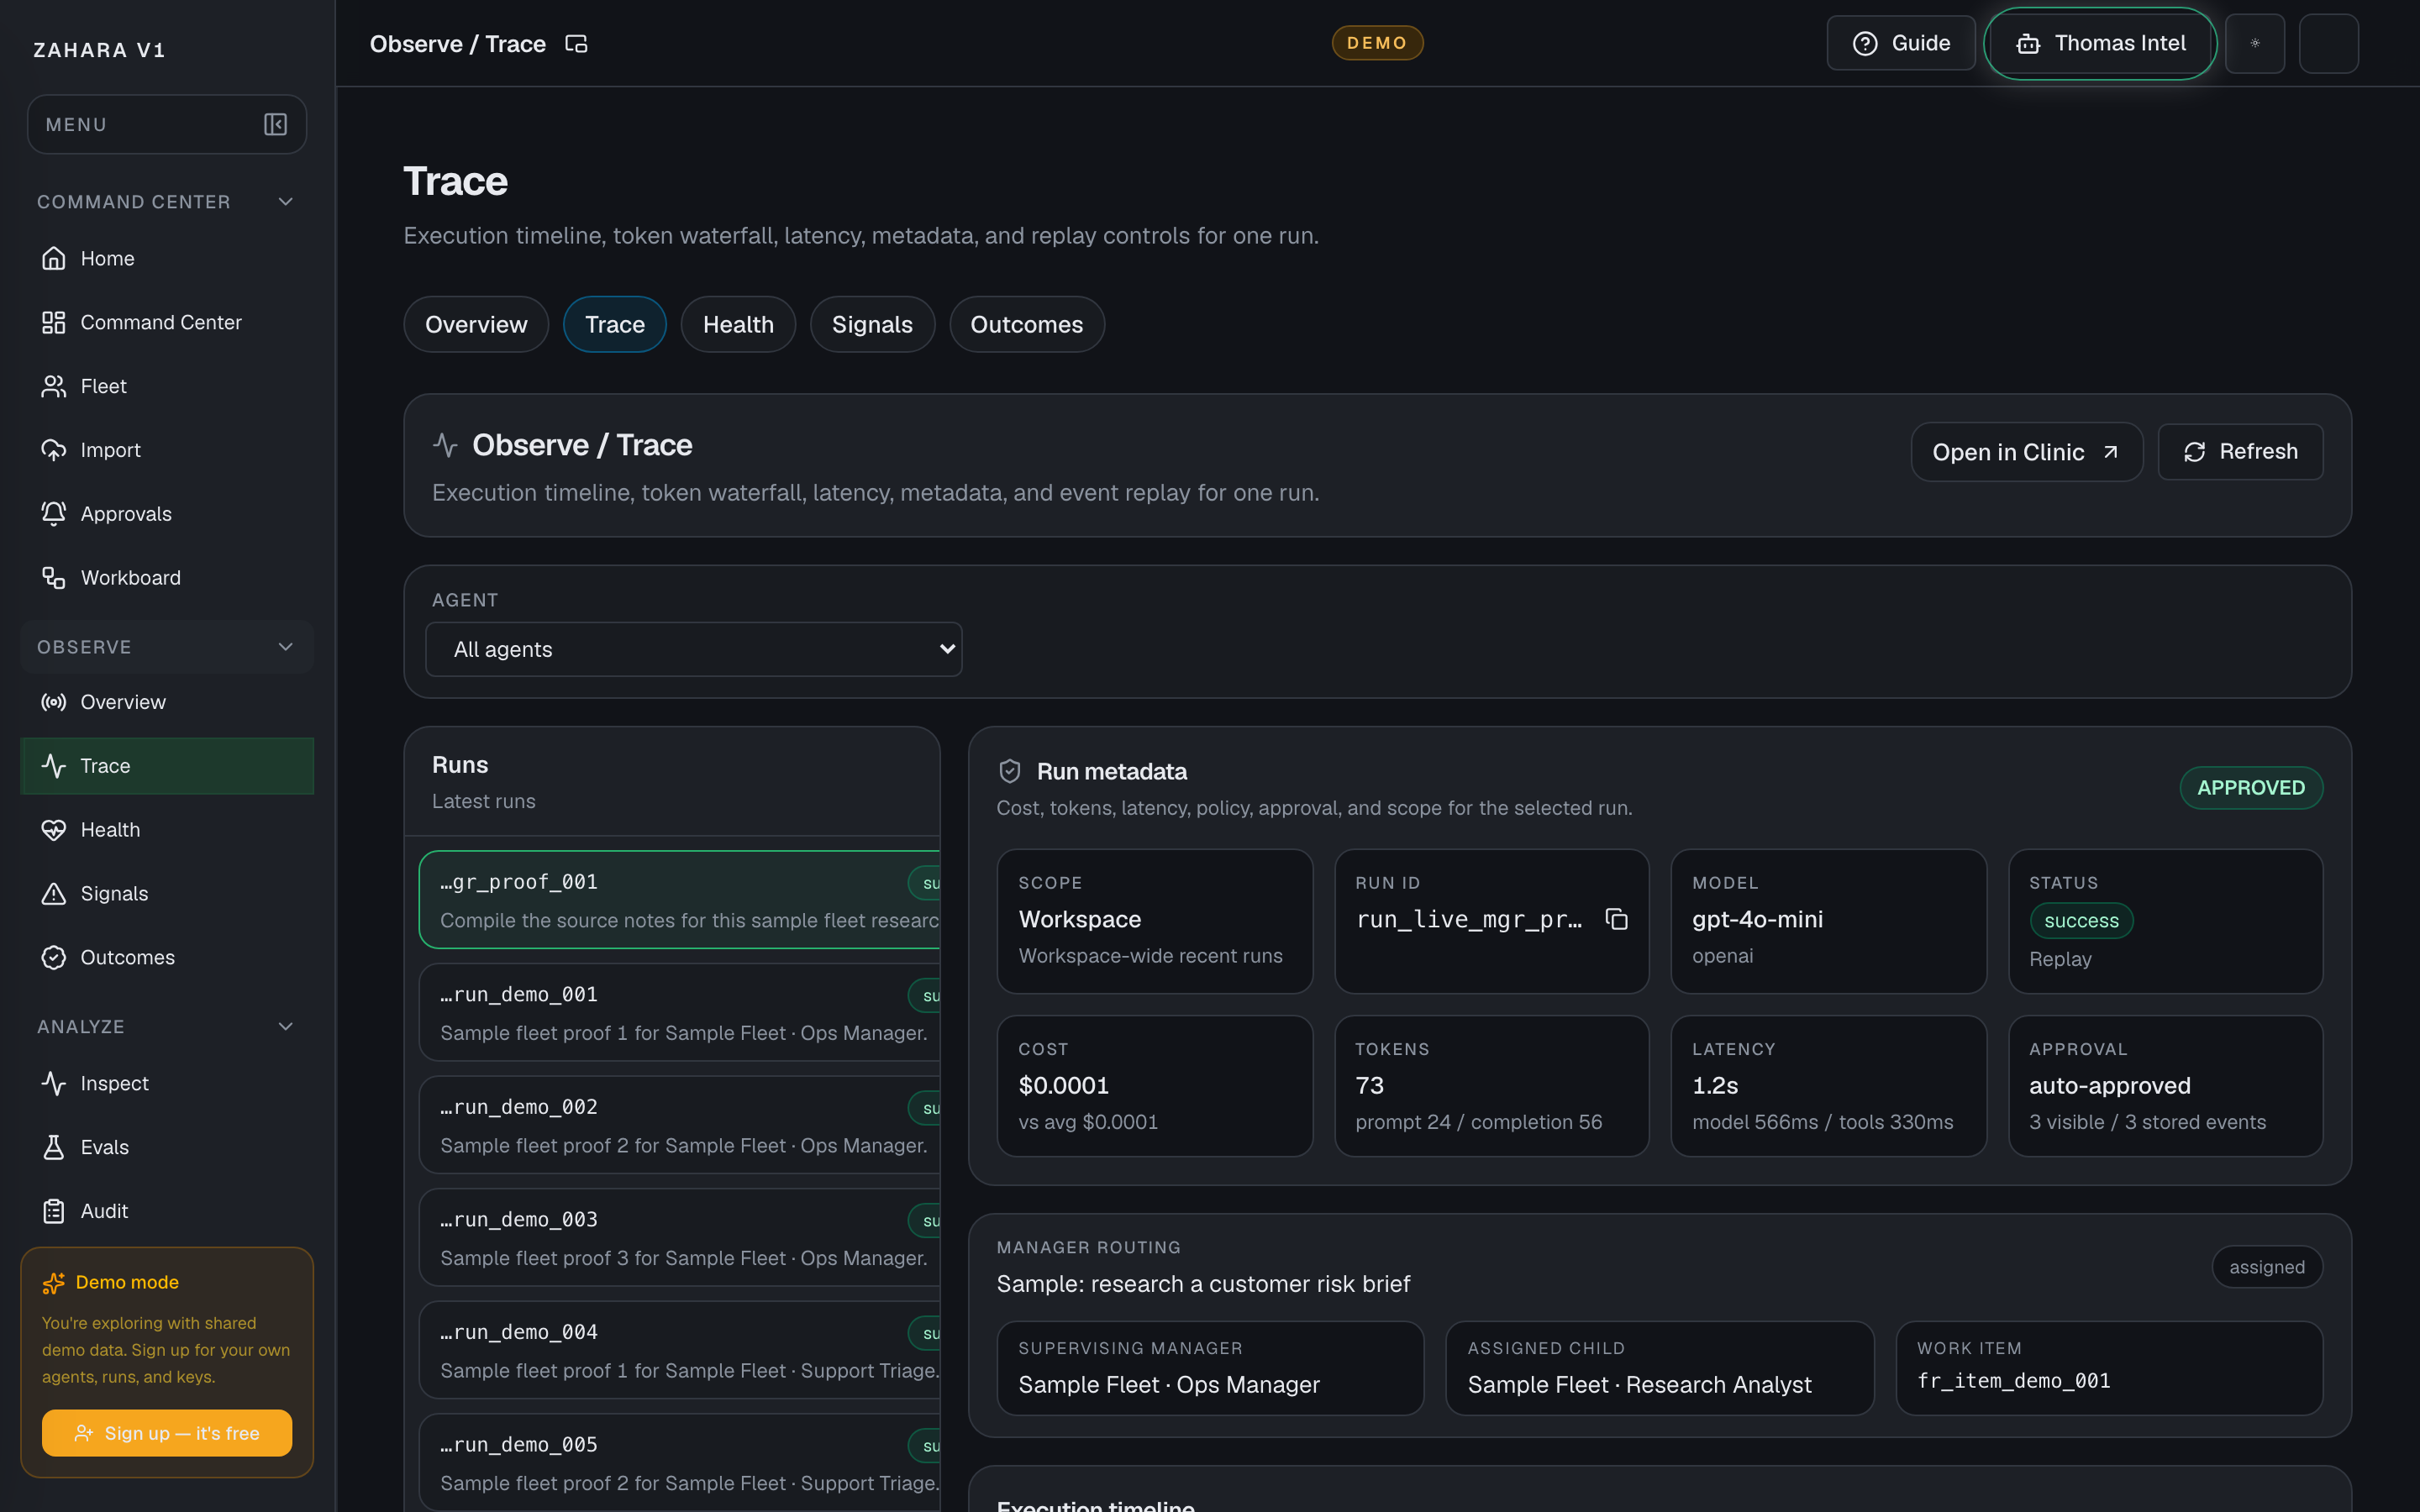
Agent Activity is the evidence lane for one agent: runs, inspect details, audit events, and version history when versions are available.
Value to users
It lets operators prove what happened before changing settings, retrying work, or trusting the latest result.
Use it when
- You need to review the latest run, error, audit trail, or version before acting.
- Status shows a warning and you need the exact evidence behind it.
- A reviewer wants to compare current behavior with previous saved versions.
Next safe action
Start with Runs, open the newest relevant run in Inspect, compare Audit events, then use Versions only when the question is about spec lineage.
Related Guide pages
Options and features
| Option | What it does | Value it adds | How to use it |
|---|---|---|---|
| Runs | Lists recent run status, input preview, latency, and links to Inspect or Trace. | Shows whether the agent has real execution evidence or only configuration. | Open the newest failed, slow, or suspicious run first. |
| Inspect | Shows selected run details, cost, tokens, latency, events, output, and error context. | Makes the difference between a bad answer, a failed tool call, and a missing setup visible. | Use Inspect before changing prompts or runtime caps. |
| Audit | Lists saved operational events tied to this agent. | Confirms whether a run, pause, save, import, approval, or system action actually happened. | Compare audit timestamps with the run or version you are investigating. |
| Versions | Shows signed saved spec snapshots and restore actions when version history is present. | Keeps edits reversible and makes draft/live lineage reviewable. | Use this when a regression appears after a prompt, policy, or schema edit. |
Basic workflow
- 1Open Activity from the agent tab bar or a Status card.
- 2Use Runs for the timeline.
- 3Select Inspect when a run needs evidence.
- 4Open Audit when you need to prove who or what changed state.
- 5Use Versions when you need to compare or restore a saved spec.
Proof that it worked
- Runs show loaded, unavailable, or empty states honestly.
- Inspect links preserve the agent or run ID.
- Audit rows include event type, actor, timestamp, and summary.
- Versions show signed snapshots when available.
- Activity does not pretend missing telemetry is the same as no runs.
Before you start
- Confirm you are on /agents/ and looking at the right workspace.
- Read visible status, warning, or empty-state text before clicking an action.
- If the page shows IDs, copy the relevant agent, run, onboarding, or request ID before switching pages.
If you get blocked
- If the page is empty, check whether filters, scope, or time window are hiding the data.
- If an action is locked, follow the visible lock reason before trying another route.
- If Agent Activity does not answer the question, open the linked evidence page instead of guessing.
Useful Thomas questions
- Based on the visible state, what is the next safe action?
- Which status, warning, or ID should I verify first?
- Which linked evidence page proves this Agent Activity state?
Agent Observe
What it is
Agent Observe is the one-agent observability view, scoped to this agent or to this manager's child team when the agent supervises other agents.
Value to users
It keeps runtime health, child-agent comparison, blocked work, traces, and Workboard routing close to the agent being reviewed.
Use it when
- You need to compare a manager agent's children before routing more work.
- You want observability without losing the current agent context.
- You need to jump from an agent into Trace, Workboard, or broader Observe with the right filters already set.
Next safe action
Read the scoped health cards first, then open the child, Trace, or Workboard link that matches the active risk.
Related Guide pages
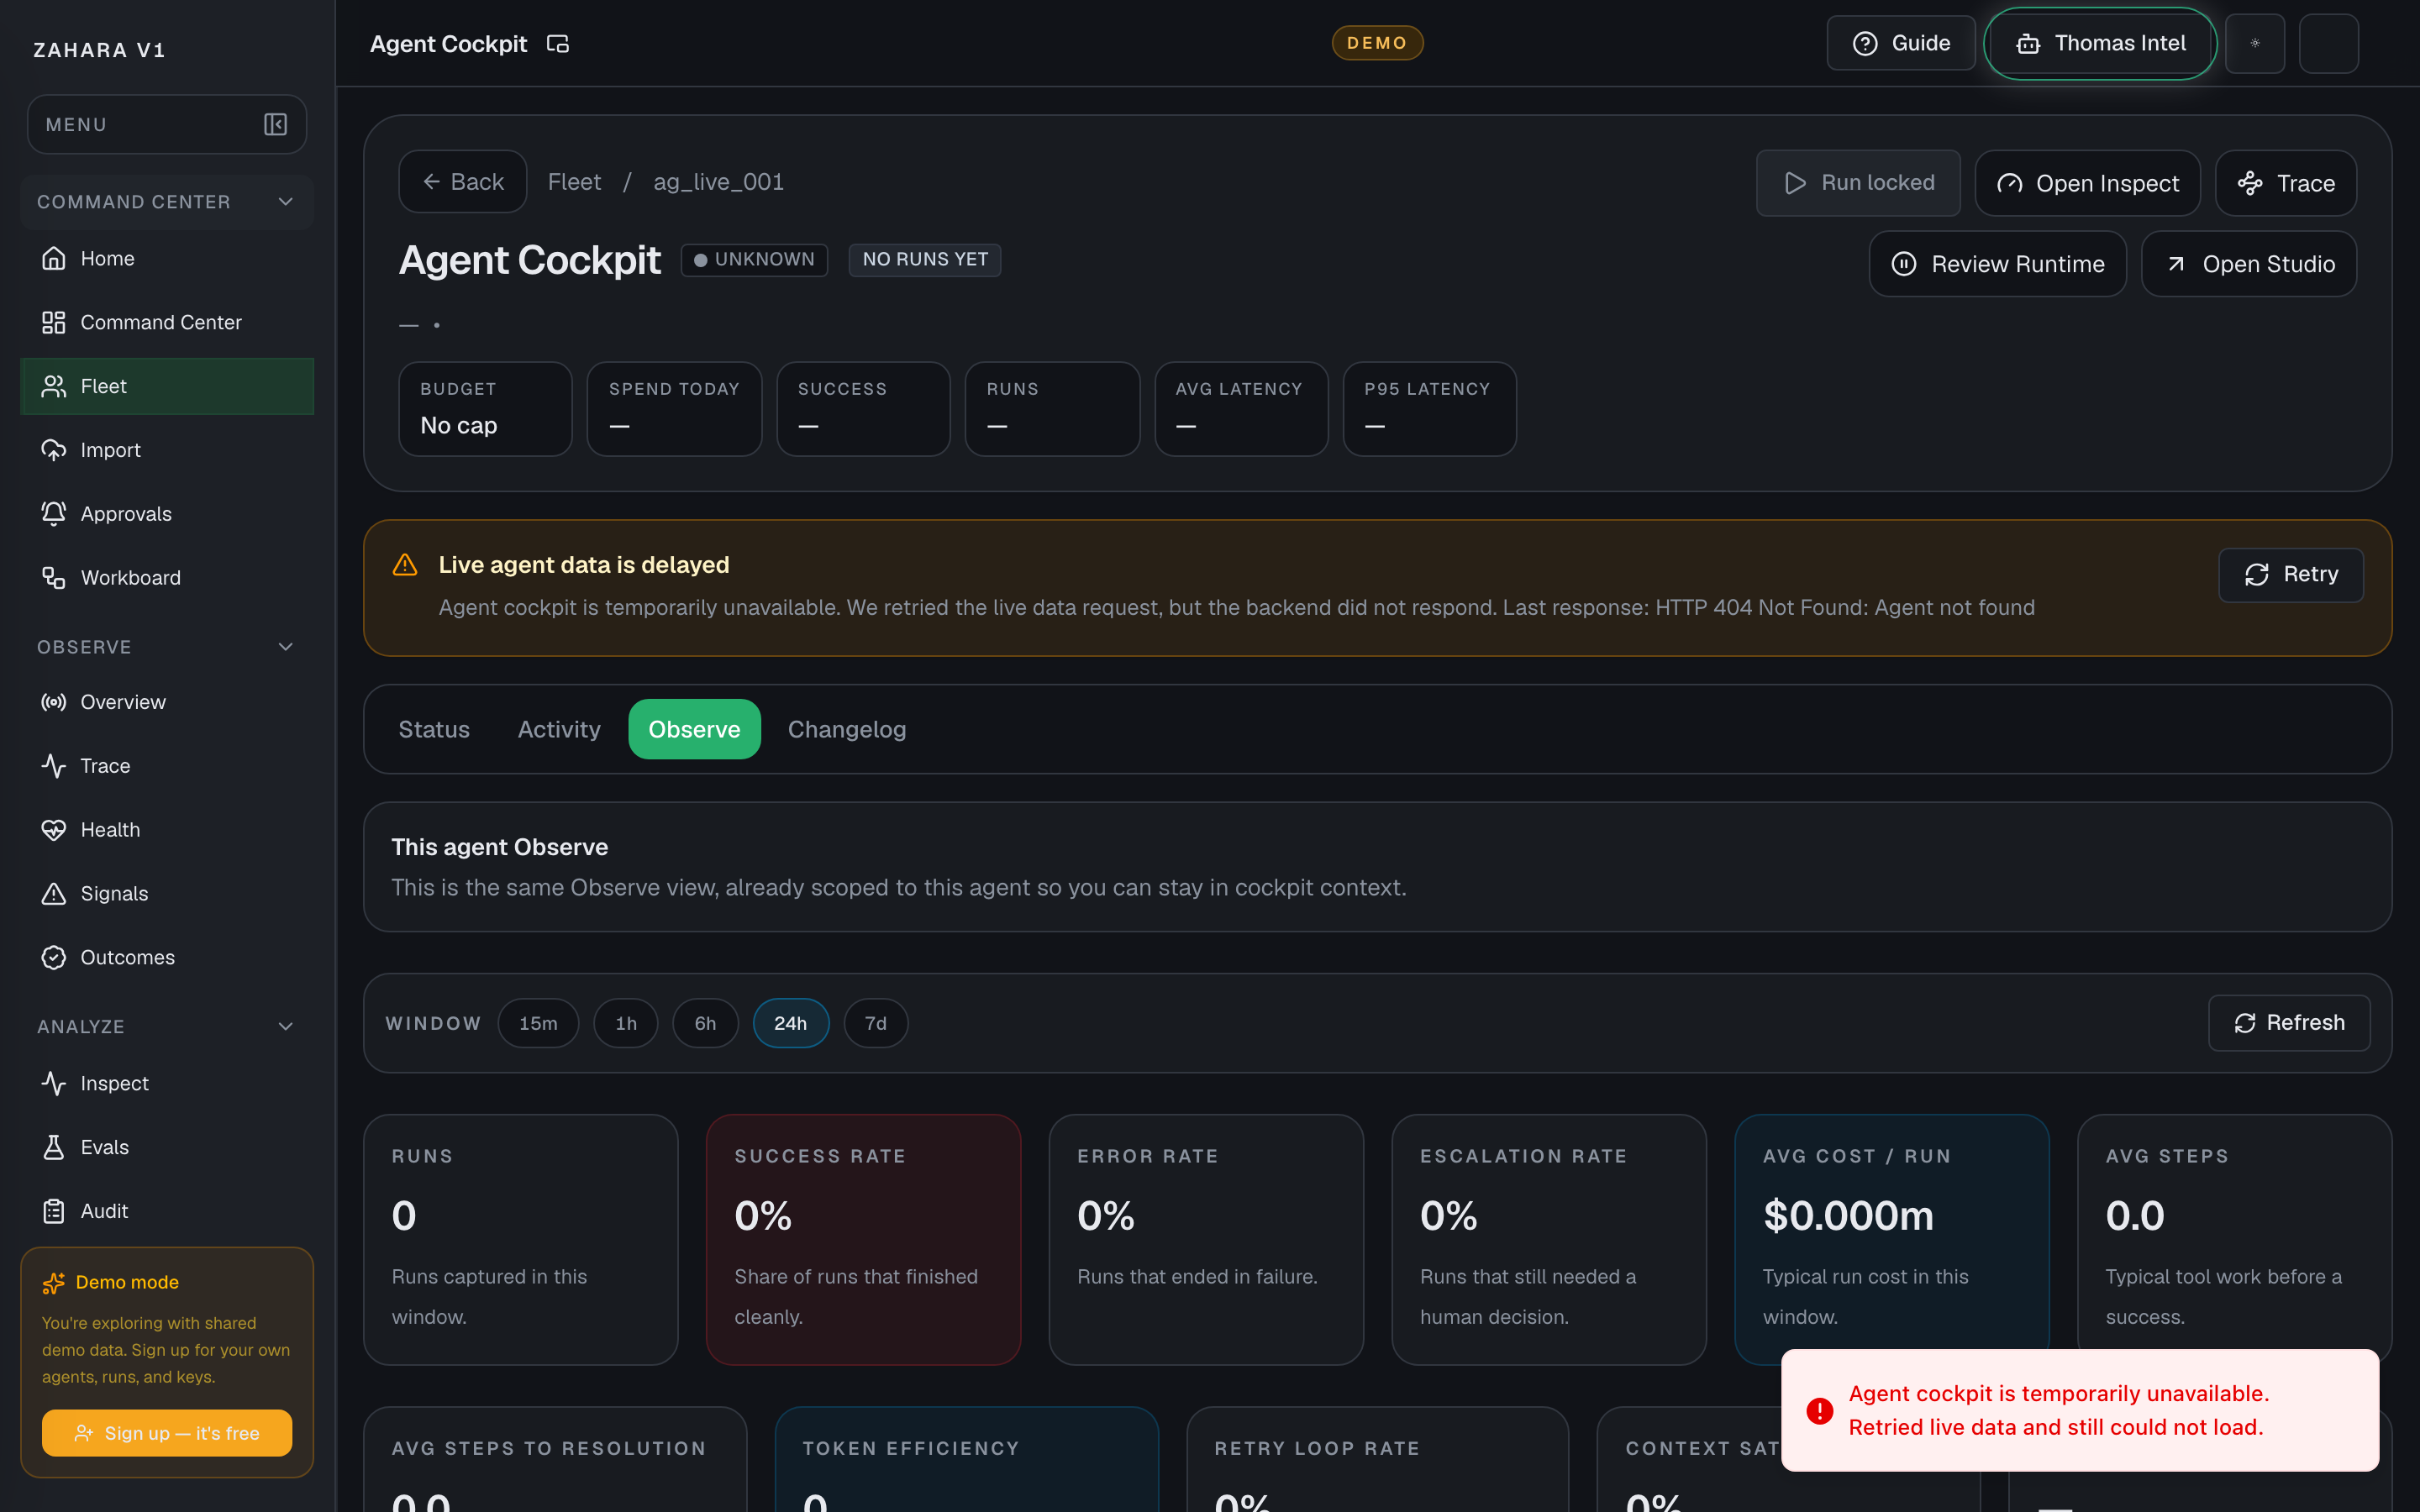
Options and features
| Option | What it does | Value it adds | How to use it |
|---|---|---|---|
| Scoped health | Shows health, runs, failures, latency, and cost for the current agent context. | Keeps one-agent investigation focused instead of forcing a global Observe scan. | Use it after Status or Activity shows a runtime concern. |
| Manager rollup | Shows child agents, blocked work, review state, and routing links for manager agents. | Makes manager-to-child supervision visible at the cockpit level. | Open the blocked or waiting child before assigning more work. |
| Trace links | Open Trace with this agent or run already selected. | Reduces copy/paste mistakes during incident review. | Use Trace when timing, tool calls, or step-by-step execution matters. |
| Workboard links | Open manager or agent work queues with the relevant filter. | Connects health signals to the work cards that need action. | Use Workboard when the next action is routing, review, or proof card cleanup. |
Basic workflow
- 1Open Observe from the agent tab bar.
- 2Check scoped health and recent risk signals.
- 3For manager agents, compare child cards and blocked work.
- 4Open Trace for execution timing or tool-step evidence.
- 5Open Workboard when the next action is a card decision.
Proof that it worked
- Observe remains scoped to the selected agent ID.
- Manager agents show child cards and manager Workboard links.
- Trace links preserve agent or run filters.
- Risk signals explain whether the next page should be Trace, Workboard, or Configure.
Before you start
- Confirm you are on /agents/ and looking at the right workspace.
- Read visible status, warning, or empty-state text before clicking an action.
- If the page shows IDs, copy the relevant agent, run, onboarding, or request ID before switching pages.
If you get blocked
- If the page is empty, check whether filters, scope, or time window are hiding the data.
- If an action is locked, follow the visible lock reason before trying another route.
- If Agent Observe does not answer the question, open the linked evidence page instead of guessing.
Useful Thomas questions
- Based on the visible state, what is the next safe action?
- Which status, warning, or ID should I verify first?
- Which linked evidence page proves this Agent Observe state?
Agent Changelog
What it is
Agent Changelog turns recent run and agent events into a plain-English timeline for one agent.
Value to users
It gives operators and demo reviewers a quick narrative before they dive into raw runs, audit rows, or trace events.
Use it when
- You need to tell what changed recently without reading every run event.
- A reviewer asks for a high-level history of one agent.
- You are preparing a demo and need a compact story of recent behavior.
Next safe action
Read the newest changelog entry, then open Activity or Audit when the entry needs proof.
Related Guide pages
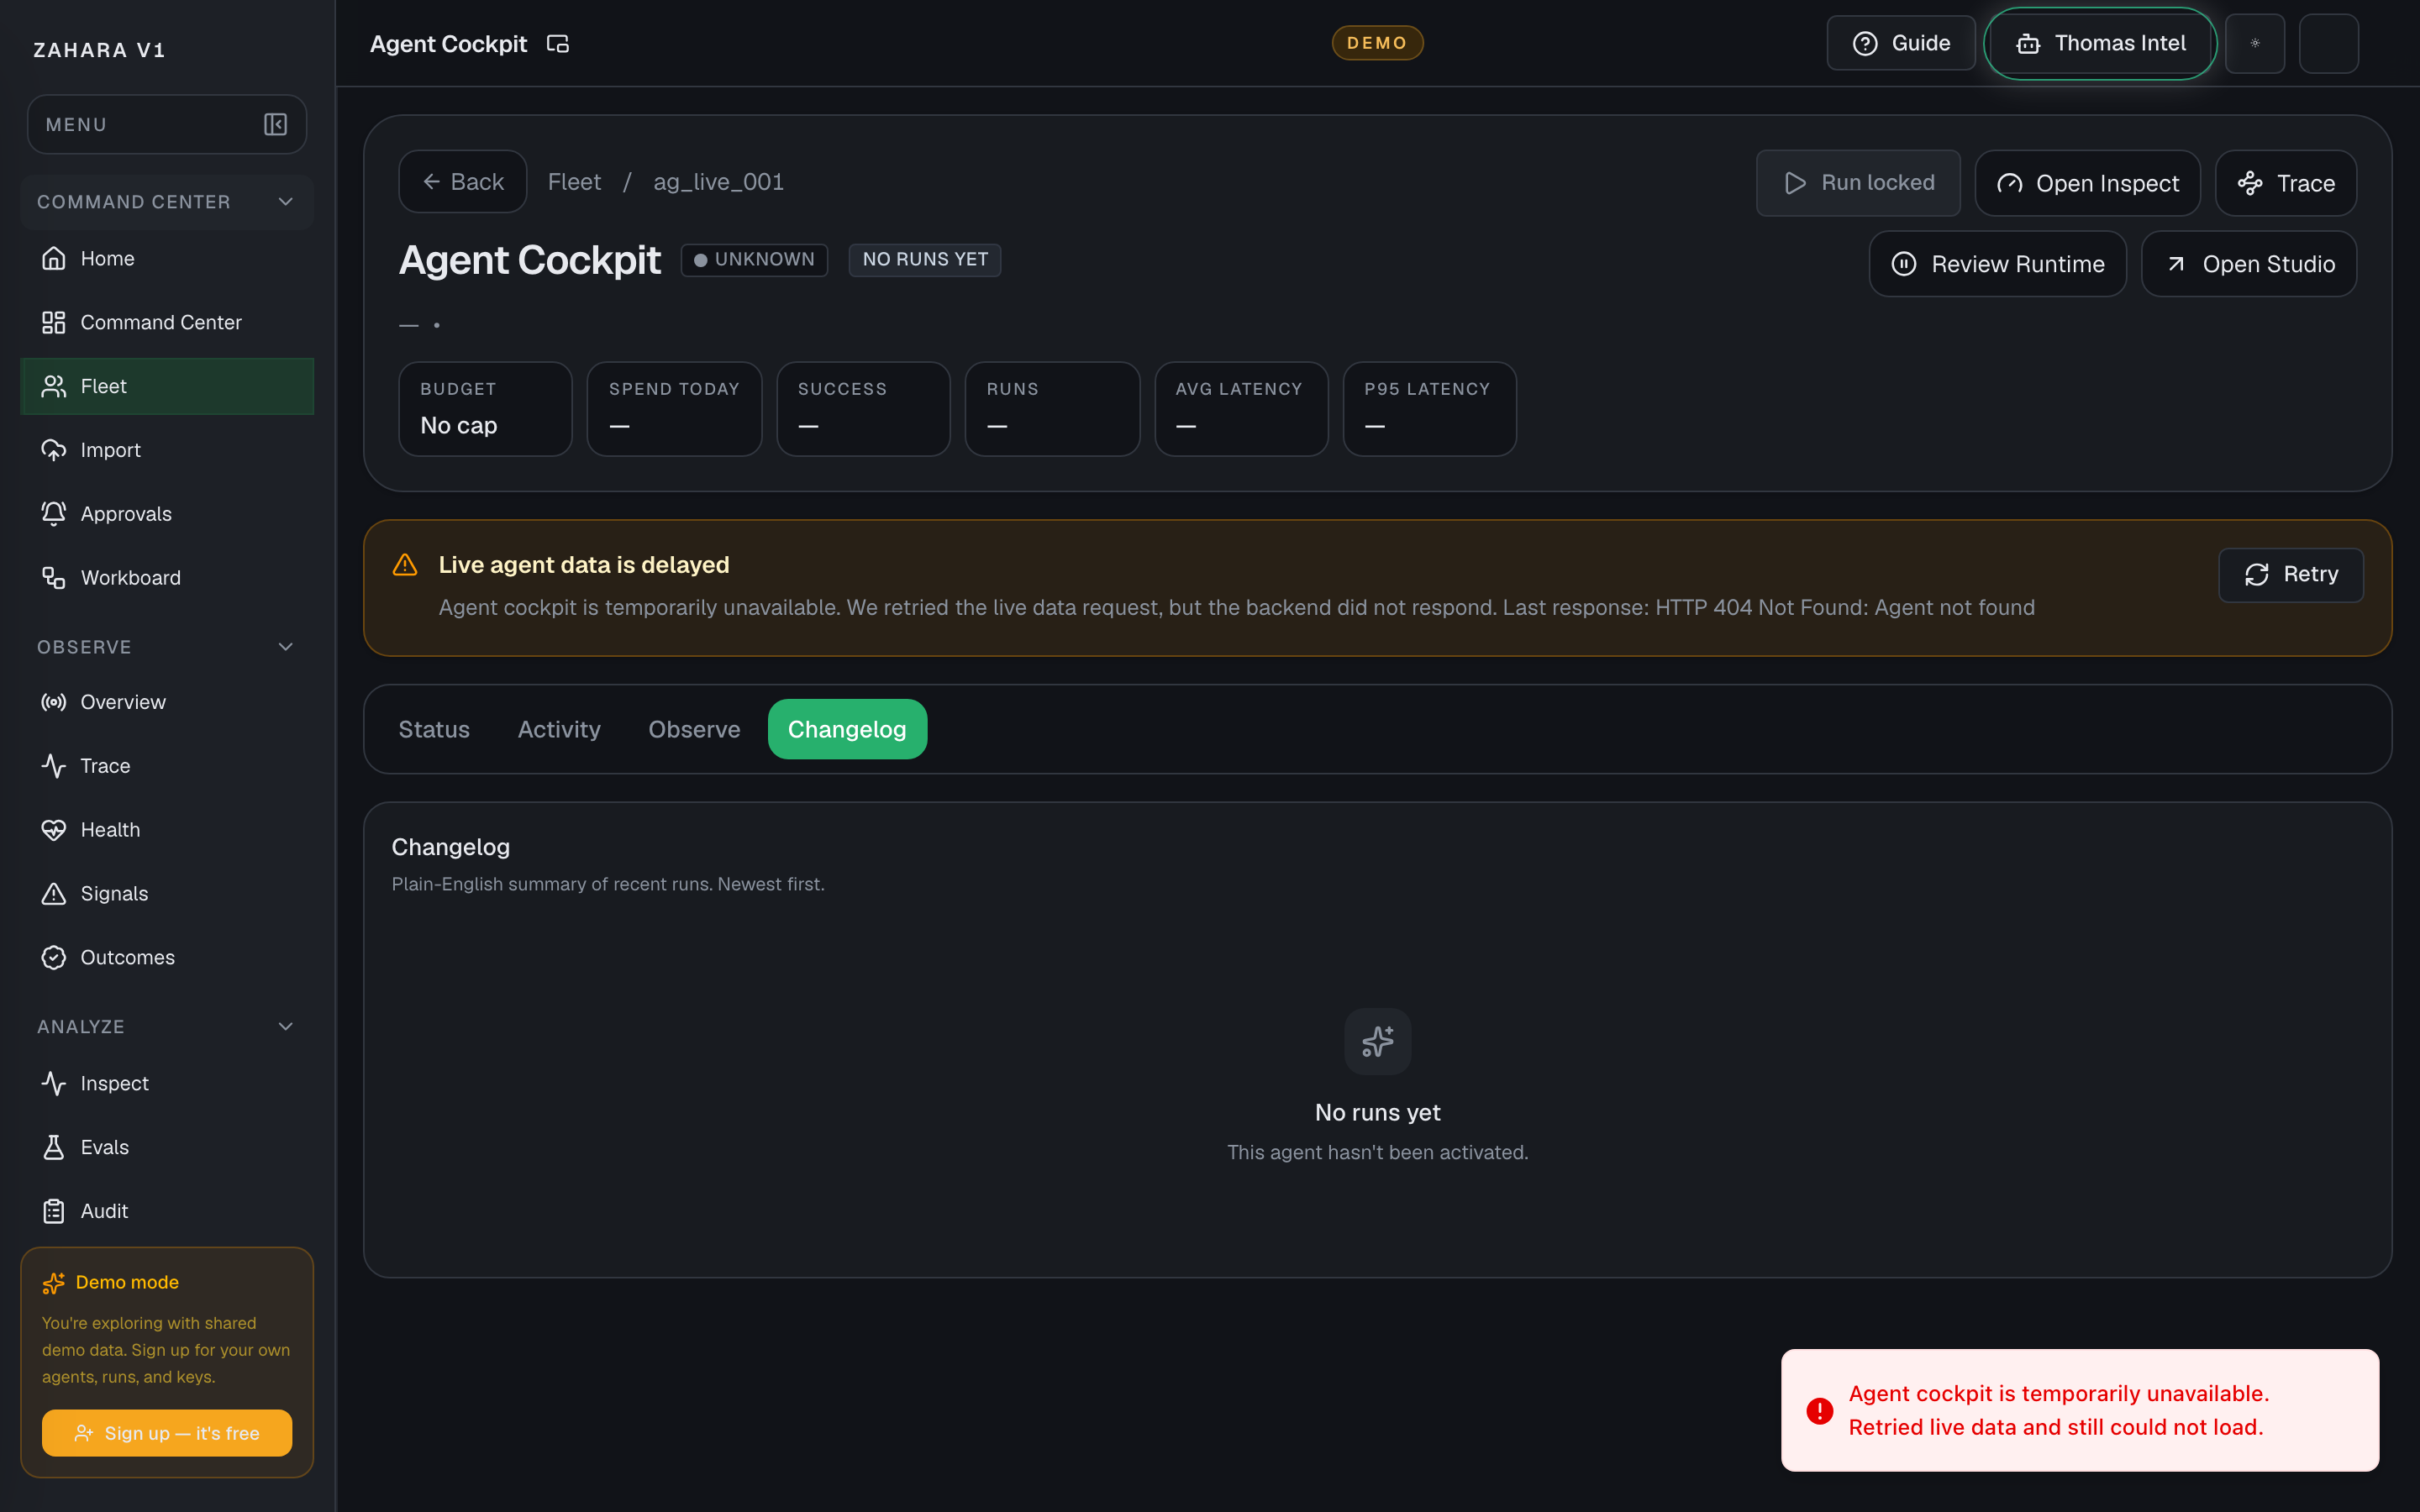
Options and features
| Option | What it does | Value it adds | How to use it |
|---|---|---|---|
| Newest first summary | Orders recent changes and run outcomes from newest to oldest. | Keeps the latest agent story visible without scrolling through raw events first. | Start at the top and open Activity if the summary raises a question. |
| Run-derived entries | Summarize run outcomes, failures, and notable result changes from available run data. | Makes the timeline useful even before a separate release-note process exists. | Use it to brief a reviewer, then verify important claims in Inspect or Audit. |
| Proof handoff | Points the user back to Activity, Inspect, and Audit when the narrative is not enough. | Keeps the changelog readable without making it the final authority. | Treat it as the story layer, not the evidence layer. |
Basic workflow
- 1Open Changelog from the agent tab bar.
- 2Read the newest entry first.
- 3If an entry mentions a run or operational change, open Activity for the evidence.
- 4Use Audit when you need actor, timestamp, or state-change proof.
- 5Use the changelog as demo narration only after the evidence pages still match.
Proof that it worked
- Changelog tab opens without a blank state or 404.
- Entries are plain English and newest first.
- The page makes it clear this is a summary, not a replacement for Activity or Audit.
- Activity and Audit remain the proof path for important entries.
Before you start
- Confirm you are on /agents/ and looking at the right workspace.
- Read visible status, warning, or empty-state text before clicking an action.
- If the page shows IDs, copy the relevant agent, run, onboarding, or request ID before switching pages.
If you get blocked
- If the page is empty, check whether filters, scope, or time window are hiding the data.
- If an action is locked, follow the visible lock reason before trying another route.
- If Agent Changelog does not answer the question, open the linked evidence page instead of guessing.
Useful Thomas questions
- Based on the visible state, what is the next safe action?
- Which status, warning, or ID should I verify first?
- Which linked evidence page proves this Agent Changelog state?
Workboard
What it is
Workboard is Zahara's board for turning agent work into visible cards with an owner, status, proof, and a next safe action.
Value to users
It keeps teams from losing work in chats, background runs, or scattered tools. Every card moves through To do, In progress, In review, and Done / stopped, with the detail drawer showing what happened, what proof exists, who owns the decision, and whether a retry is safe.
Use it when
- Queue org work for agents or operators without starting it immediately.
- Import the Fleet proof queue before beta runs.
- See what work is waiting, claimed, in review, or done.
- Open a card drawer to read the latest report and next decision before touching it.
- Scan proof status, cost, latency, tokens, model, and audit match before opening Inspect.
- Re-run Import proof queue after proof runs to refresh existing proof cards.
- Catch repeated attempts, blockers, or stopped cards before choosing another retry.
Next safe action
Start from the board columns. Use Add work for one manual card, Import for proof or feed cards, then select a card to open the drawer. Keep cards on Run once by default; turn on Loop only when the latest proof shows another pass would add value.
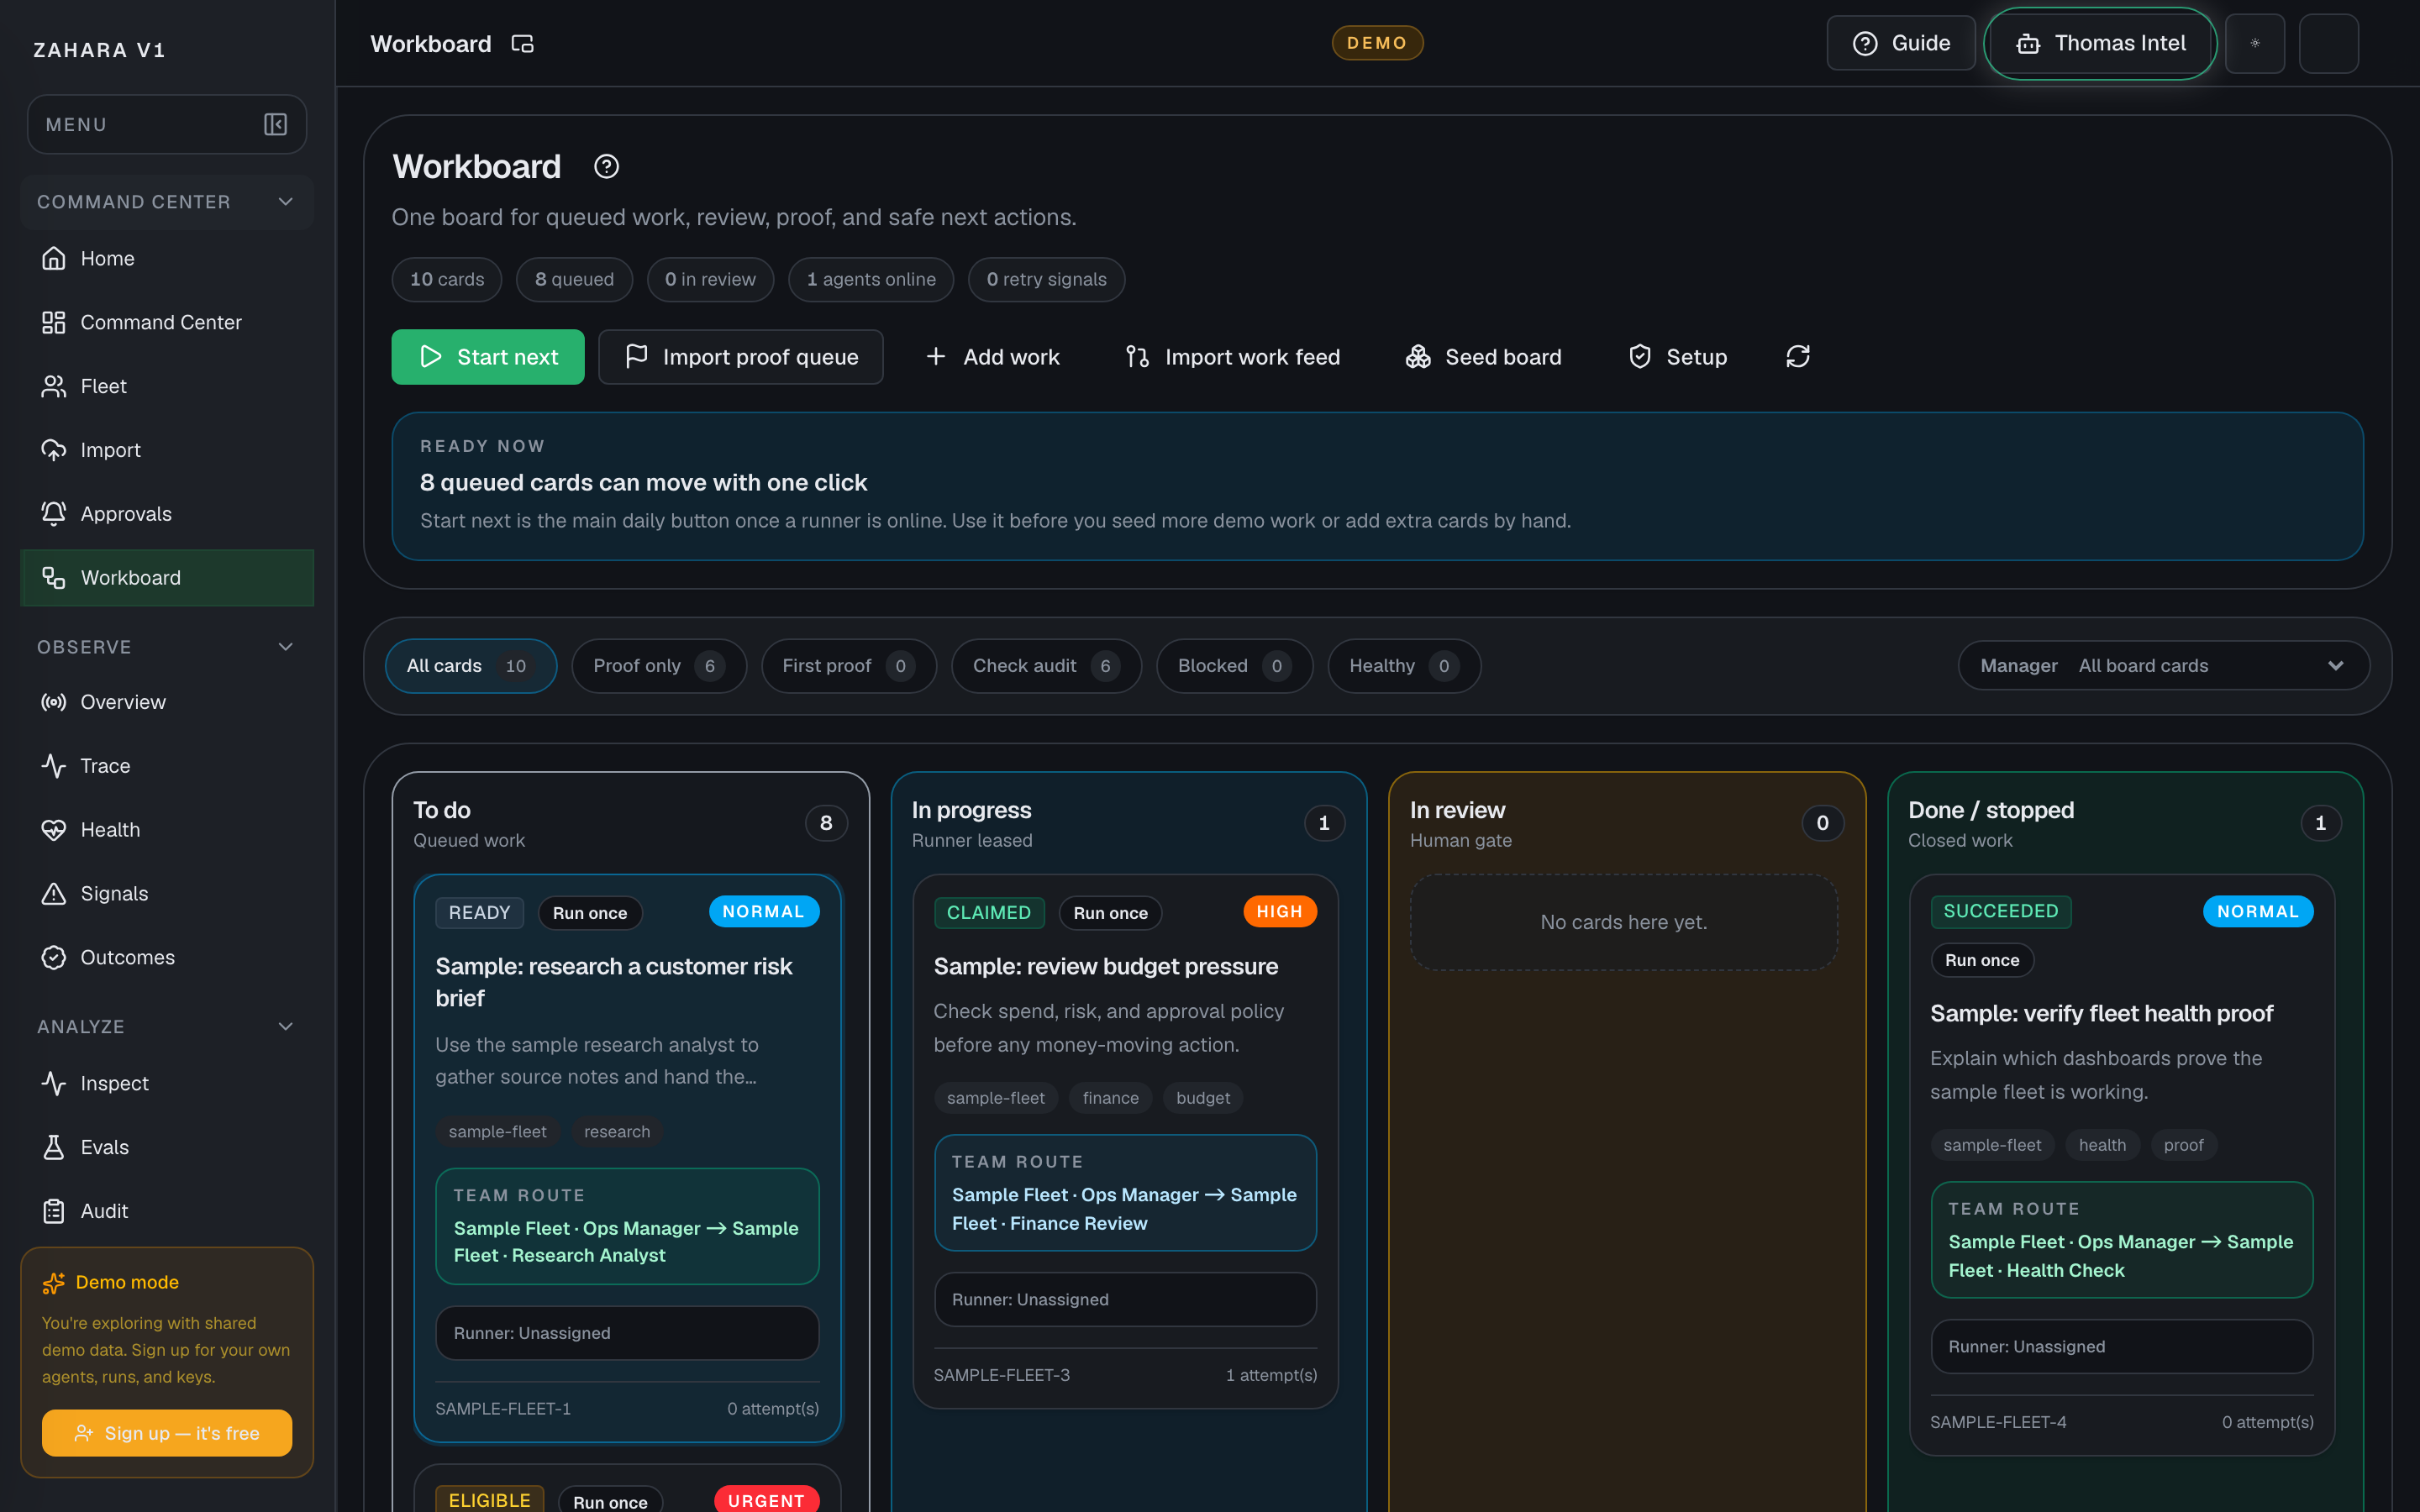
Options and features
| Option | What it does | Value it adds | How to use it |
|---|---|---|---|
| Add card | Creates a manual work card without starting an agent. | Lets users capture work before automation is ready. | Enter a task title, details, priority, then add the card. |
| Page pop-out | Launches a chrome-free Workboard monitor for a second-screen runner queue and proof backlog from the app header. | Lets an operator watch queued, running, review, runner, and event state while fixing work elsewhere. | Use the small pop-out icon beside the page title during an operations session, then use Back to app when a card needs action. |
| Customize layout | Lets an operator reorder Workboard monitor cards and reset them to the default order. | Supports different runner desk, review desk, and proof-watch preferences without changing the shared board. | Use it in `/workboard/live`; changes are saved in this browser only, so each operator station can keep its own queue wall layout. |
| Run mode | Lets users choose between Run once and Loop. | Keeps repeat work intentional so cards do not keep running after one good pass. | Use Run once for the default path. Read What happened last, the cost reminder, and the card guidance first, then turn on Loop only when another pass is worth the added cost. |
| Import work feed | Syncs configured source items into Workboard cards. | Turns outside work into a shared operating queue. | Use it when a source is ready and you want fresh cards. |
| Import proof queue | Creates or refreshes Fleet-derived proof cards for agents that need evidence. | Makes beta proof work explicit and keeps existing cards current after new runs land. | Click it, select a proof card, then use Open the right page to choose the deeper proof surface you need. |
| Proof view | Filters the board to all cards, proof cards, first proof, audit checks, blocked proof, or healthy proof. | Lets operators narrow the board to the proof slice that needs attention before opening cards. | Start on All cards, then switch to a proof view when you want to scan only proof work. Workboard explains the active proof slice and gives you a quick way back to all cards. |
| Manager inbox | Filters the board to one manager-owned queue or one manager routing state without opening another page. | Lets startup and marketing leads work their team desk directly on Workboard while keeping proof, review, and routing on the same cards. | Pick one manager, choose the team slice you want, then assign, reassign, or return cards for review from the selected card panel. |
| Starter desk cards | Shows the first manager-owned queue created from a Fleet operating pack. | Gives a new team something useful to route and review immediately instead of starting from an empty board, including custom desks built by the manager. | Load the operating pack from Fleet first, then open the manager inbox and use the seeded cards as the day-one queue for that team. |
| Start next | Claims the next eligible card for a runner lease. | Moves work forward without two agents stepping on the same task. | Use when a runner is ready and the To do column has eligible work. |
| Agent report and decision brief | Summarizes the latest agent report, human decision state, next safe action, proof count, and retry status for the selected card. | Gives operators one readout before they approve, retry, stop, or inspect work. | Select a card, read the brief, then follow the next safe action instead of jumping across pages first. |
| Collapsible card sections | Keeps manager routing, next action, proof, review, and workspace detail available without making every card detail block equally loud all the time. | Lets teams keep the selected-card surface learnable while still opening deeper proof or lease detail only when they need it. | Start with Next action and run mode, then expand Manager routing, Proof and source record, Review packet, or Workspace / lease only when the card needs that level of detail. |
| Manager routing | Shows which manager owns the card, which child agent is assigned, and the recent routing trail. | Keeps startup and marketing team supervision visible on the card instead of hiding it in side conversations. | Choose a manager first, assign a child only when execution should move, and return the card for review when the manager needs to decide the next safe action. |
| Suggested route | Reads the selected card for a likely work lane, checks the manager's saved routing rules first, and then falls back to the manager's default child for that lane. | Cuts repetitive routing clicks without hiding the manager's decision or taking away the override, especially when one phrase should usually go to one child. | Save routing defaults and any recurring phrase rules on the manager row in Fleet first, then use the suggestion box on Workboard as a starting point before you save or override the route. |
| What happened last and cost reminder | Explains the latest stop or review state and reminds the user when another pass would add cost. | Makes repeat work easier to judge without digging through multiple panels first. | Read it before switching to Loop so the team knows whether the extra pass is actually worth it. |
| Run proof and cost | Shows latest proof run status, cost estimate, latency, token count, model route, and audit match for the selected proof card. | Lets operators judge whether an agent proof is healthy and affordable before leaving Workboard. | Select a Fleet proof card, scan the proof summary, then open a deeper page only when Workboard's summary is not enough. |
| Proof state | Shows proof state on proof cards and in the selected-card readout. | Helps users tell the difference between first proof, waiting on audit, blocked proof, review-ready proof, and healthy proof without opening every card. | Scan the card badge across the board first, then read the full Proof state card after you select the proof card. |
| Next step | Shows the best immediate proof action on proof cards in the board view. | Lets teams scan what to do next before opening a card. | Use the badge as the quick action hint, then confirm the full reason in Start here after selecting the card. |
| Start here | Highlights the best next proof page for the selected card. | Gives users one clear next click instead of making them guess between agent, Inspect, Trace, and Audit proof. | Read the short reason, use the suggested page first, then fall back to Open the right page when you need another surface. |
| Open the right page | Explains when to open the agent page, Inspect, Trace, or Audit proof for the selected proof card. | Stops users from guessing which page to open next after reading the Workboard summary. | Read the one-line purpose under each link, then open the page that matches the decision you need to make. |
| Retry signals | Highlights cards with repeat attempts, blockers, guardrail stops, or failed/stopped states. | Helps operators catch stuck agent work before they intentionally start another retry. | Use the Retry signals stat for the board view, then open any card with a watch or stuck badge before choosing a retry. |
| Remove from board | Deletes a stale card and its attached runtime evidence once no live lease is still running. | Keeps starter desks, proof cards, and abandoned experiments from piling up after the team has already learned what it needed. | Select the stale card, stop or kill any active lease first, then use Remove from board in the selected-card action row. |
Basic workflow
- 1Import work or add a card.
- 2Use the page-title pop-out when Workboard should stay visible on another screen.
- 3Use Customize layout in the Workboard monitor when this station needs a different queue, runner, or event order.
- 4Use Proof view if you need to narrow the board to a proof slice before opening cards.
- 5Use Manager inbox when you need one manager-owned queue without losing the rest of Workboard.
- 6Start next or open a card drawer.
- 7Let the runner lease move the card into progress.
- 8Read the Agent report and decision brief for the selected card.
- 9Collapse the sections you do not need right now so the selected-card detail stays focused while you work.
- 10If the card belongs to a manager-owned team, confirm the manager route before sending it forward again.
- 11For Fleet proof cards, scan Run proof and cost, read Proof state, use Start here for the best next page, then use Open the right page when you need another proof surface.
- 12If the card shows Retry watch, Retry risk, Blocked, or Stopped, inspect before choosing another attempt.
- 13Review evidence when the card reaches review.
- 14Close only when evidence is attached or the stop reason is clear.
Proof that it worked
- Cards move across To do, In progress, In review, and Done.
- The page pop-out opens the Workboard wall with queue health, runner status, and recent events without the full app chrome.
- Customize layout reorders Workboard monitor cards locally and Reset layout restores the default order.
- Active tasks show who claimed work.
- Re-importing the Fleet proof queue refreshes existing proof cards instead of leaving stale run cost fields.
- Selected cards show a report, decision, next safe action, proof count, and retry status.
- Selected cards keep secondary detail in collapsible sections so proof, review, and workspace context stay easy to reopen without crowding the main action path.
- Manager-owned cards show the supervising manager, assigned child agent, and recent routing trail on the card itself.
- Selected cards explain what happened last, whether to keep Run once, and whether Loop is worth the extra pass.
- Fleet proof cards show run status, cost, latency, tokens, model, and audit match.
- Selected proof cards summarize whether proof is still missing, waiting on audit, blocked, review-ready, or healthy.
- Proof cards show a compact proof-state badge in the board view for faster scanning.
- Proof cards show a compact next-step badge in the board view so users can see the likely next move before selecting a card.
- Proof view filters the board to the proof slice you want without changing the underlying card evidence.
- When a proof view is active, Workboard explains the current proof slice and gives users a quick return to all cards.
- Manager inbox filters the board to one manager team or one team-routing state without hiding the card-level routing controls.
- Selected proof cards point to the best next page before showing the full list of deeper proof surfaces.
- Selected proof cards explain which deeper page to open for agent controls, run detail, trace, or audit evidence.
- Retry signals count stuck/watch cards and badges show the reason on affected cards.
- Repeated work stays operator-controlled instead of silently looping.
- Proof packets include agent, prompt, pass criteria, blockers, and evidence links.
- Stale cards can be removed from the board once no active lease is still running.
Before you start
- Confirm you are on /workboard and looking at the right workspace.
- Read visible status, warning, or empty-state text before clicking an action.
- If the page shows IDs, copy the relevant agent, run, onboarding, or request ID before switching pages.
If you get blocked
- If cards are not moving, check that a runner is online and has a recent heartbeat.
- If Start next is unavailable, read Live action readiness and clear provider key, runner, or queue setup first.
- If a card is stuck, inspect What happened last, blockers, and cost before turning on Loop.
Useful Thomas questions
- Why is this Workboard card blocked?
- Is Loop worth using on this card?
- Which proof page should I open from this card?
Approvals
What it is
Approvals is the human review queue.
Value to users
It keeps risky, blocked, or policy-sensitive decisions in the human loop instead of letting agents continue silently.
Use it when
- A run pauses for human review.
- A tool or capability needs approval.
- An operator needs to decide whether pending work can continue.
Next safe action
Open the oldest or highest-risk pending review, inspect the reason, then approve, reject, or request changes.
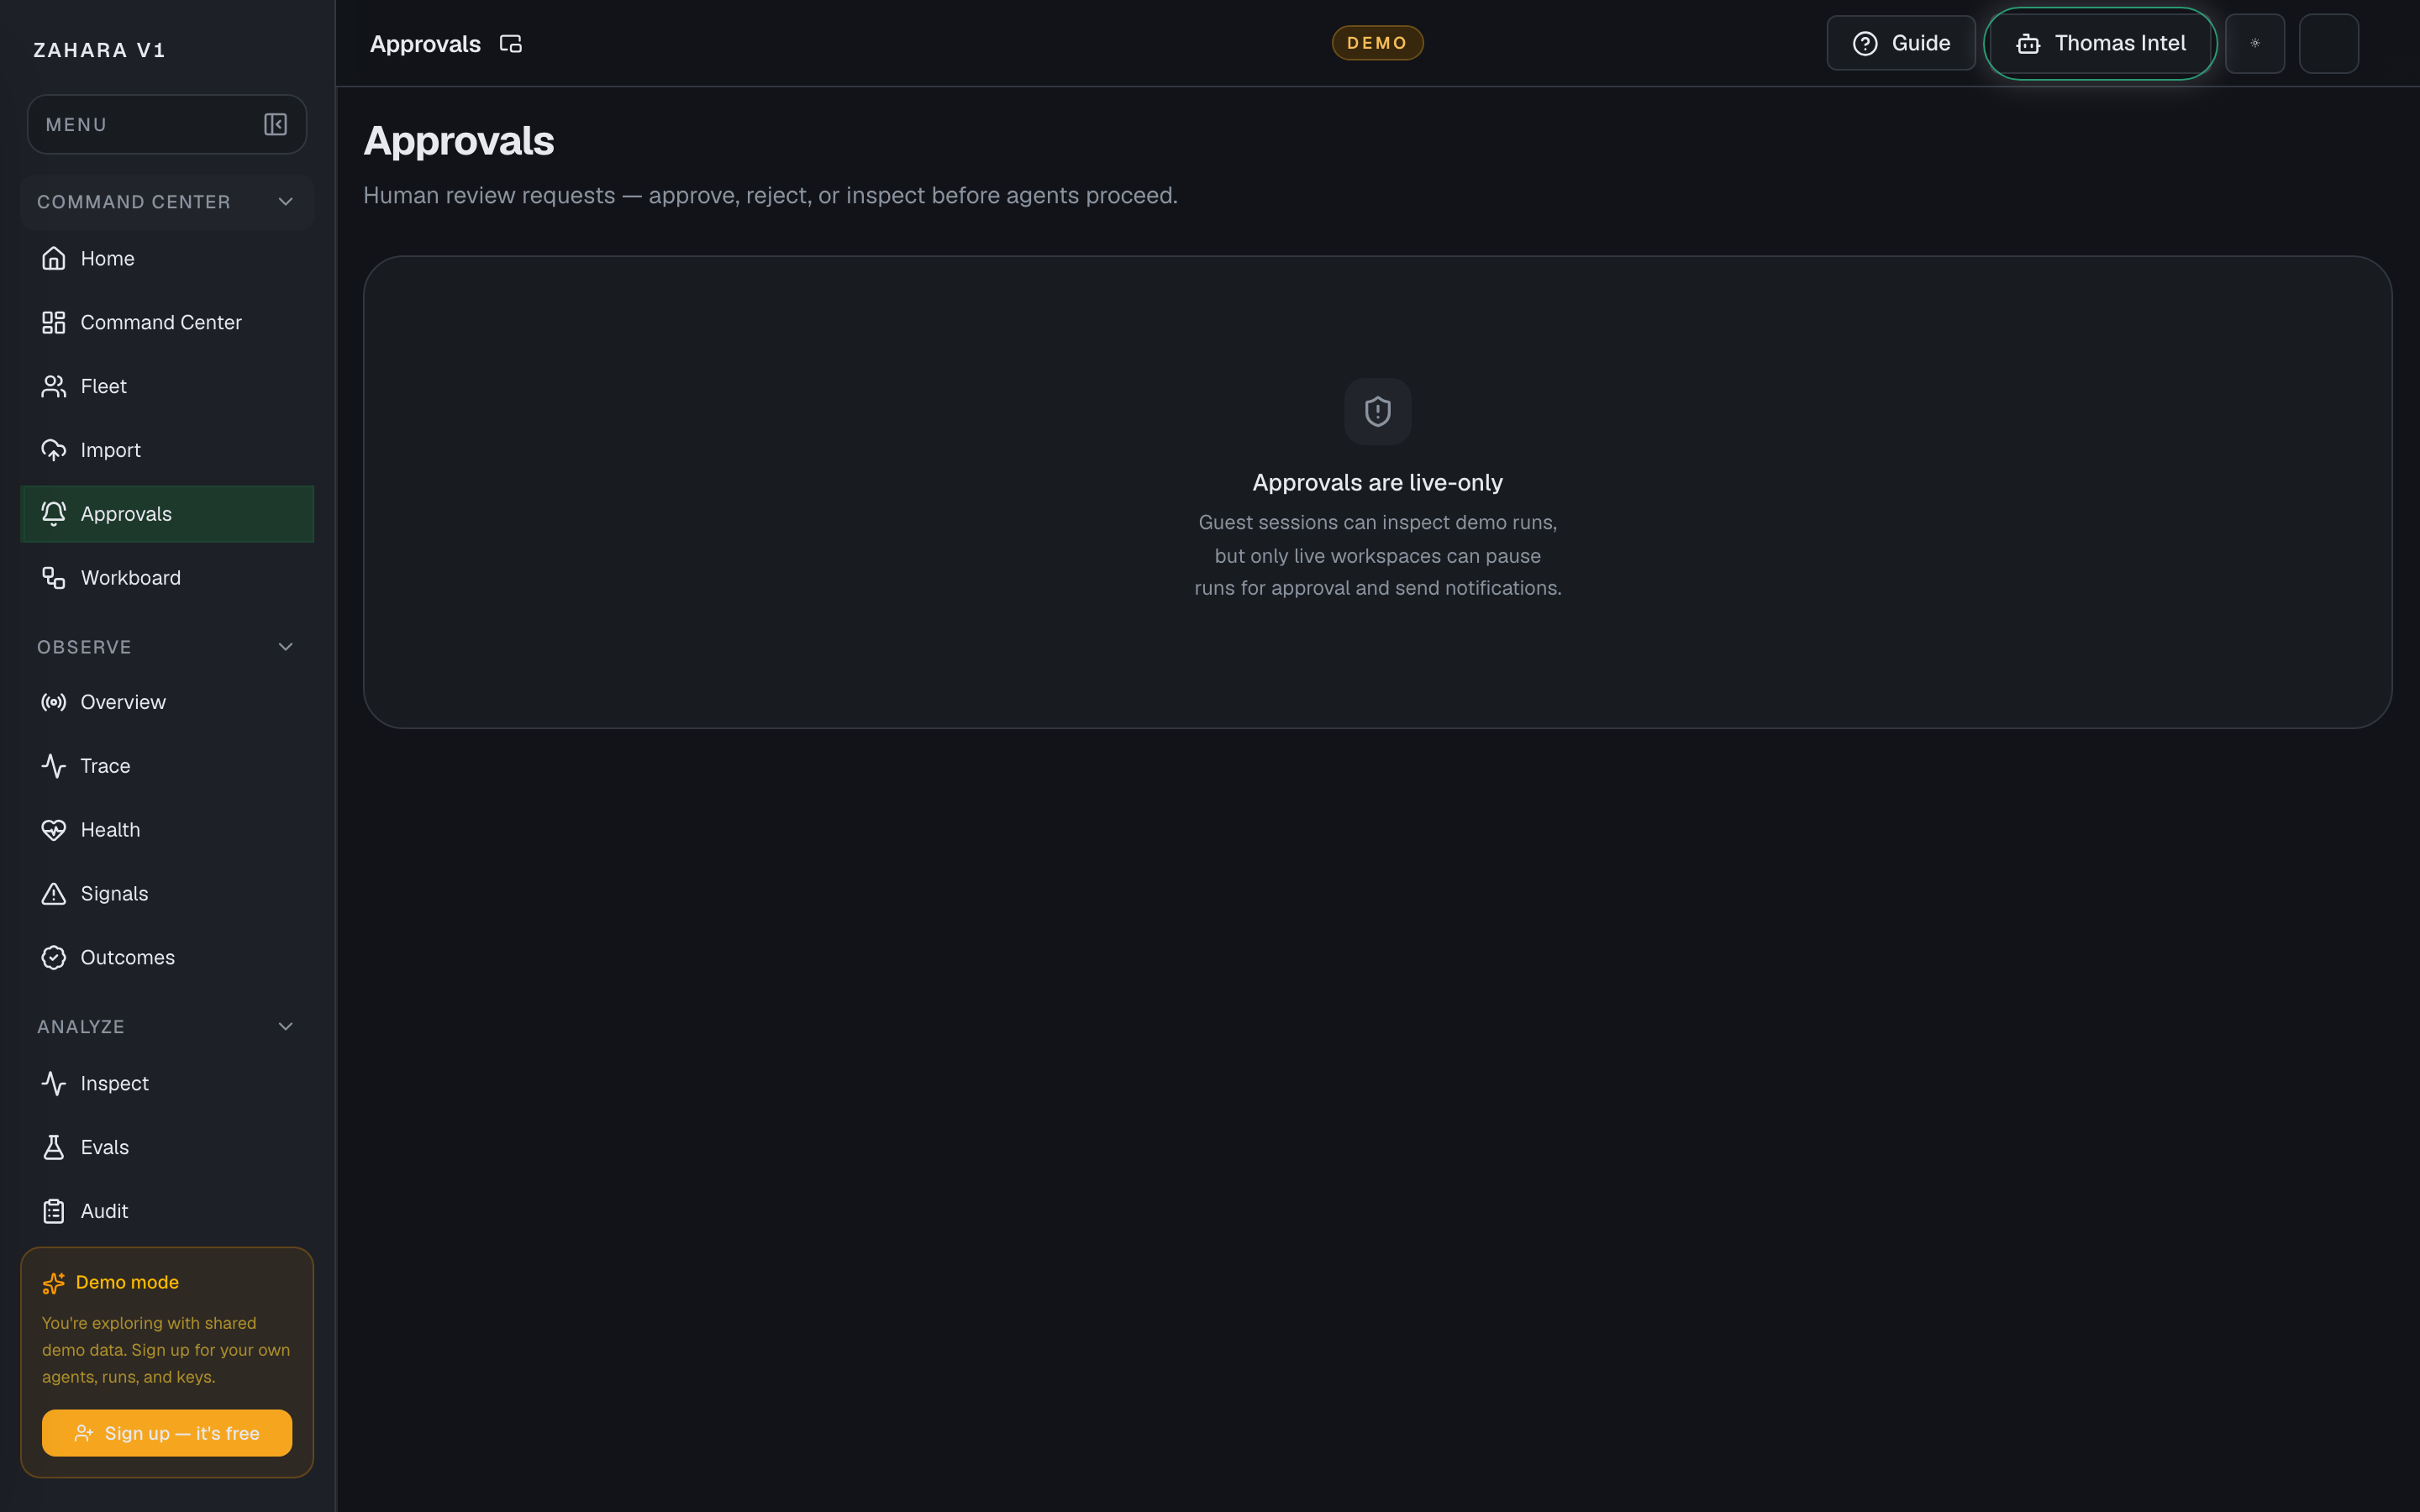
Options and features
| Option | What it does | Value it adds | How to use it |
|---|---|---|---|
| Pending queue | Lists decisions waiting for a human. | Prevents blocked agent work from disappearing. | Sort by age or risk and open the most important item first. |
| Page pop-out | Launches a chrome-free approvals monitor for the human review queue from the app header. | Lets a reviewer keep pending approvals visible on another screen without accidentally deciding from the wall view. | Use the small pop-out icon beside the page title to watch age and queue volume, then return to the full queue to approve or reject. |
| Customize layout | Lets a reviewer reorder Approvals monitor cards and reset them to the default order. | Supports different review-desk preferences without exposing approve or reject controls in the wall view. | Use it in `/approvals/live`; changes are saved in this browser only, so each review station can keep its own queue layout. |
| Approve | Allows the paused action to continue. | Keeps humans in control of consequential moments. | Approve only after inspecting the request, context, and evidence. |
| Reject or request changes | Stops or sends back risky work. | Prevents bad actions from slipping through because the agent was confident. | Record the reason so Audit explains the decision later. |
Basic workflow
- 1Open the pending item.
- 2Use the page-title pop-out when approvals should stay visible on another screen.
- 3Use Customize layout in the Approvals monitor when this station needs a different review order.
- 4Read the agent request and context.
- 5Check linked run or audit evidence.
- 6Approve, reject, or request changes.
Proof that it worked
- Decision item has a clear status.
- The page pop-out opens the approvals wall with pending approval state without exposing approve/reject controls.
- Customize layout reorders Approvals monitor cards locally and Reset layout restores the default order.
- Linked evidence is visible.
- Operator decision is recorded.
Before you start
- Confirm you are on /approvals and looking at the right workspace.
- Read visible status, warning, or empty-state text before clicking an action.
- If the page shows IDs, copy the relevant agent, run, onboarding, or request ID before switching pages.
If you get blocked
- In demo, approval cards are synthetic and read-only so you can inspect the evidence without mutating the shared workspace.
- If a review lacks context, open the linked run, eval, or audit evidence before deciding.
- If reviews are aging, handle the oldest high-risk item first.
Useful Thomas questions
- Which pending approval should I handle first?
- What evidence should I inspect before approving this?
- Why are demo approval decisions read-only?
Studio
What it is
Studio is the agent builder inside the control plane. It has four modes that all work on the same agent spec: Vibe, Flow, Pro, and Import. Vibe lets Thomas interview you and build the spec from plain language. Flow designs the agent as a visual graph of nodes and edges. Pro edits the full YAML spec directly. Import brings an external agent config in for review. Agent Cockpit Configure is the separate governance editor for policy, runtime limits, safety, and approval settings.
Value to users
It lets a team choose the right builder for the job while keeping one shared agent source, one run history, and one operational handoff path.
Use it when
- Create or edit an agent.
- Generate a first draft from a plain-language brief.
- Choose between brief-first, graph-first, spec-first, or import-first editing.
- Test a flow safely before relying on it.
- Move from idea to runnable agent structure.
Next safe action
Choose the builder that fits the job: Vibe to generate, Flow to edit the graph, Pro to edit the full spec, or Import to bring in an external agent. Use Agent Cockpit Configure when the change is governance, policy, review, runtime, or credential-sensitive.
Related Guide pages
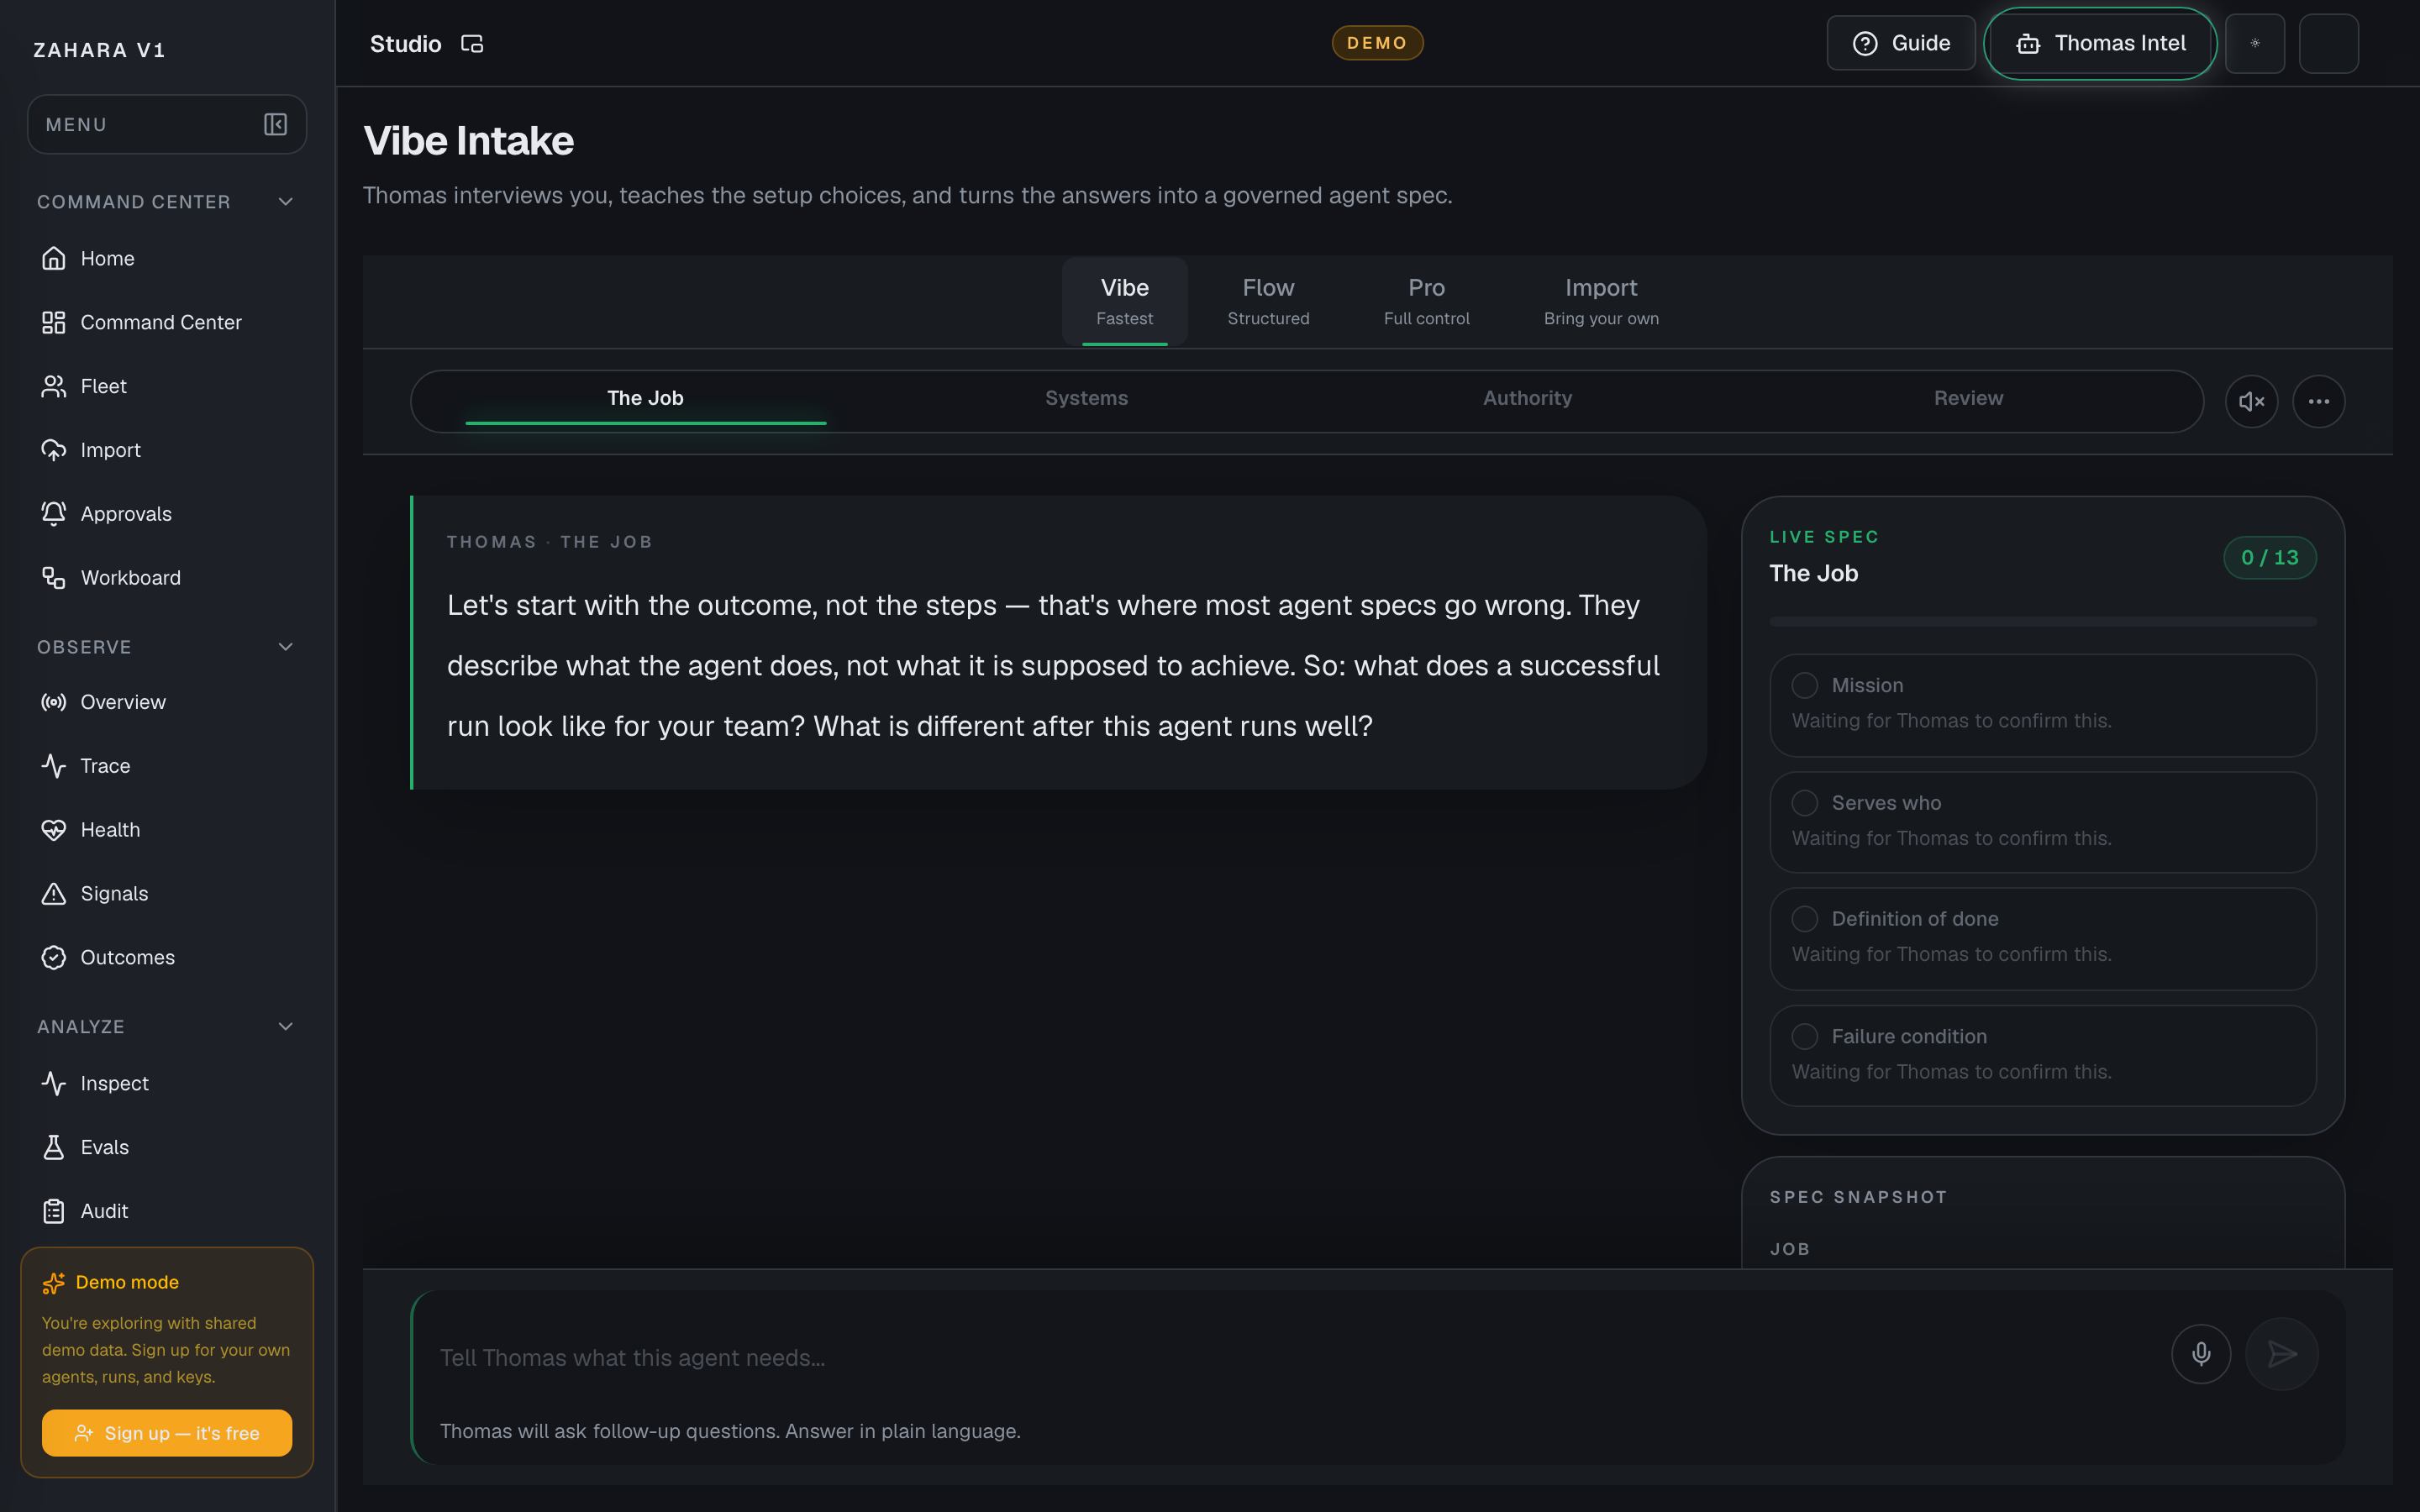
Options and features
| Option | What it does | Value it adds | How to use it |
|---|---|---|---|
| Vibe builder | Turns a short operator brief into a generated agent draft. | Lets a user get to a first runnable structure quickly instead of starting from a blank canvas. | Name the agent, describe the job clearly, then generate before deciding whether more editing is needed. |
| Flow builder | Edits the visual node graph for routing, tools, review blocks, and outputs. | Makes the agent path inspectable when the job needs graph-level control instead of prompt-only tuning. | Open Flow when you need to change nodes, edges, routing, or guardrail structure. |
| Pro builder | Edits the deeper prompt, spec, policy, and file-level configuration directly. | Gives advanced builders a direct surface for detailed changes without forcing them through Vibe or Flow first. | Open Pro when the work is spec-heavy, policy-heavy, or needs direct text editing. |
| Import builder | Starts from an external agent source, template, runtime, or supported format. | Lets existing agents enter the same saved-agent lifecycle instead of living outside Zahara governance. | Open Import when you already have an agent, workflow, prompt, or runtime to bring under control. |
| Agent Cockpit Configure | Edits the saved agent's governance settings outside Studio: identity, instructions, speed and cost, triggers, tools, review rules, runtime, and related policy. | Keeps high-impact operational controls in the cockpit while Studio remains the build/edit workspace. | Open Configure from the Agent Cockpit or Fleet when the change affects policy, review, runtime, safety, or production readiness. |
| Save draft | Creates the shared saved agent without pushing the user into another builder. | Keeps the builder choice optional while still preserving the draft for later work. | Save first when the draft looks worth keeping but does not need a proof run yet. |
| Test Agent | Saves the draft and opens the Test Console for a safe proof run. | Creates evidence quickly so a user can prove the draft behaves as expected. | Use it first when you want to validate behavior before doing more editing. |
| Open cockpit | Saves the draft and opens the Agent Cockpit for status, controls, and evidence links. | Gives builders a direct path into the live agent view instead of making Fleet discovery guesswork. | Use it when you want to confirm the saved agent, runtime posture, and next operational moves. |
| View in Inspect | Opens the run evidence view after the draft has been tested. | Closes the build -> proof -> evidence loop without making the user hunt for runs manually. | Use it after a test run to confirm status, latency, cost, and review state. |
Basic workflow
- 1Open Studio and choose Vibe, Flow, Pro, or Import based on the kind of edit you need.
- 2Generate or edit the agent in the chosen builder.
- 3Save the draft so the same agent is available across Studio lenses and Agent Cockpit Configure.
- 4Use Test Agent for a safe proof run.
- 5Open Cockpit or Inspect to review status and evidence.
- 6Switch builders only when a specific edit calls for it; switch to Configure when the change is governance-owned.
Proof that it worked
- The saved agent can be opened from Studio's Vibe, Flow, Pro, and Import lenses where supported.
- Agent Cockpit Configure shows the governance fields for the same saved agent.
- Draft can be saved without forcing a builder-to-builder handoff.
- Test run reaches terminal or review state.
- Inspect can explain the result.
Before you start
- Confirm you are on /studio and looking at the right workspace.
- Read visible status, warning, or empty-state text before clicking an action.
- If the page shows IDs, copy the relevant agent, run, onboarding, or request ID before switching pages.
If you get blocked
- If the page is empty, check whether filters, scope, or time window are hiding the data.
- If an action is locked, follow the visible lock reason before trying another route.
- If Studio does not answer the question, open the linked evidence page instead of guessing.
Useful Thomas questions
- Based on the visible state, what is the next safe action?
- Which status, warning, or ID should I verify first?
- Which linked evidence page proves this Studio state?
Builders overview
What it is
Builders overview explains how Studio's Vibe, Flow, Pro, and Import lenses work with Agent Cockpit Configure around one versioned agent spec instead of separate products.
Value to users
It gives operators a simple mental model for choosing the right builder lens, switching tabs safely, and trusting that saved changes belong to the same agent draft.
Use it when
- A user is unsure whether to use Vibe, Flow, Pro, Import, or Agent Cockpit Configure.
- A reviewer needs to confirm all build and configure surfaces are reading the same saved spec.
- A builder wants to know why a field is visible in Flow but editable only in Configure.
- A teammate needs the source-of-truth story before a demo.
Next safe action
Load the target agent, choose the lens that owns the edit, save the draft, then switch to another surface only to verify or continue from the same agentId.
Related Guide pages
One spec, Studio lenses, and Configure
The saved agent spec is the shared center. Studio provides Vibe, Flow, Pro, and Import lenses; Agent Cockpit Configure edits governance for the same saved draft.
Options and features
| Option | What it does | Value it adds | How to use it |
|---|---|---|---|
| One versioned spec | Stores identity, instructions, IO contract, model, tools, knowledge, triggers, safety, runtime, lifecycle policy, source sync, and Flow graph data together. | Prevents each builder from inventing its own copy of the agent. | Treat the saved draft as the source of truth. Publish only when the draft has evidence. |
| Agent Cockpit Configure | Owns governance, policy, runtime, approval, lifecycle, and source settings outside Studio. | Keeps sensitive controls in one calm settings surface. | Use Configure when changing policies such as Identity, Instructions / Behavior, Speed & Cost, Triggers, Safety, Runtime, Alerts, Quality / Evals, or Self-improvement. |
| Flow lens | Owns graph wiring while showing read-only summaries for Configure-owned policy. | Lets builders reason about the run path without hiding the rules that still apply. | Use Flow to change nodes and edges. Use the banners and deep links when policy needs editing. |
| Pro lens | Owns raw agent.yaml authoring and validates the file against agent.schema.json. | Gives advanced builders a complete spec surface with save-time validation and round-trip warnings. | Use Pro for code-like edits, schema checks, and full-spec review before switching back to Configure or Flow. |
| Vibe and Import entry points | Start work from a natural-language brief or an external agent source. | They feed the same saved agent lifecycle without becoming separate source-of-truth surfaces. | Use them to create or ingest, then continue in Agent Cockpit Configure, Flow, or Pro for precise edits. |
| Guide as source of truth | Documents the behavior that shipped with the code. | Keeps product review, demos, and Thomas answers aligned with the current UI. | Use the related Guide pages before treating a builder change as done. |
Basic workflow
- 1Open Studio with the agentId for the agent you are editing.
- 2Pick Vibe for a brief-first draft, Flow for graph wiring, Pro for raw YAML, Import for external sources, or Agent Cockpit Configure for governance.
- 3Save changes as a draft tied to that agent.
- 4Switch to another surface to verify the same spec data appears there.
- 5Use Test Agent, Inspect, or Audit before publishing or demoing the change.
Proof that it worked
- The URL keeps the same agentId while switching Flow and Pro.
- Configure-owned fields appear in Flow as read-only policy banners or panels.
- agent.yaml includes the same policy and graph fields that Agent Cockpit Configure and Flow render.
- Guide links explain each builder behavior without requiring tribal knowledge.
Before you start
- Confirm you are on /studio and looking at the right workspace.
- Read visible status, warning, or empty-state text before clicking an action.
- If the page shows IDs, copy the relevant agent, run, onboarding, or request ID before switching pages.
If you get blocked
- If the page is empty, check whether filters, scope, or time window are hiding the data.
- If an action is locked, follow the visible lock reason before trying another route.
- If Builders overview does not answer the question, open the linked evidence page instead of guessing.
Useful Thomas questions
- Based on the visible state, what is the next safe action?
- Which status, warning, or ID should I verify first?
- Which linked evidence page proves this Builders overview state?
What changed this version
What it is
What changed this version is the dated Studio Coherence Sprint changelog for the builder-source-of-truth work.
Value to users
It gives reviewers and demo operators one short reference for what shipped, which Guide pages explain it, and what proof should be visible in the product.
Use it when
- Prepare a demo of the Studio builder changes.
- Review whether a sprint PR included matching Guide content.
- Find the right feature page after hearing that Flow, Pro, or Configure behavior changed.
Next safe action
Start with Builders overview, then open the feature page for the specific control you are reviewing.
Related Guide pages
Options and features
| Option | What it does | Value it adds | How to use it |
|---|---|---|---|
| Date | Marks this entry as the May 13, 2026 Studio Coherence Sprint update. | Keeps future change notes from blurring together. | Use this page as the model for the next dated version entry. |
| Agent picker shipped | Adds Load agent to Flow and Pro, duplicate-as-new-agent, URL agentId sharing, and shared builder context. | Existing agents can reopen in the builder instead of forcing blank starts. | Read Loading existing agents into the builder for the full behavior. |
| Flow policy awareness shipped | Adds Start, Agent, Tool, Knowledge, Guardrails, Output, and canvas-level read-only policy summaries with Configure deep links. | Flow now shows the policies that apply to each block without duplicating Configure edit controls. | Read How Flow blocks reflect agent-level policy for each banner and linked section. |
| Pro full-spec schema shipped | Expands agent.yaml, exposes read-only agent.schema.json, validates saves, and warns before any unrepresentable field could be dropped. | Pro can act as the raw full-spec lens rather than a prompt-only editor. | Read The agent.yaml schema before editing or reviewing full YAML changes. |
| Guide rule codified | Adds GUIDE_STYLE.md and reinforces that code changes need matching Guide content. | Future PRs have a simple review standard for product docs. | Use the Guide style rules repo link on this page before authoring a new Guide page. |
Basic workflow
- 1Open this changelog before a Studio Coherence review.
- 2Follow the related links to the feature-specific Guide page.
- 3Compare the Guide proof checklist with the visible product behavior.
- 4Block follow-up PRs that change behavior without updating the matching Guide page.
Proof that it worked
- This page links to Builders overview, Loading existing agents, Flow block policy, and agent.yaml schema.
- Each linked page names routes, user value, workflow, and proof.
- GUIDE_STYLE.md exists at the repo root and describes the Guide writing rules.
Before you start
- Confirm you are on /studio and looking at the right workspace.
- Read visible status, warning, or empty-state text before clicking an action.
- If the page shows IDs, copy the relevant agent, run, onboarding, or request ID before switching pages.
If you get blocked
- If the page is empty, check whether filters, scope, or time window are hiding the data.
- If an action is locked, follow the visible lock reason before trying another route.
- If What changed this version does not answer the question, open the linked evidence page instead of guessing.
Useful Thomas questions
- Based on the visible state, what is the next safe action?
- Which status, warning, or ID should I verify first?
- Which linked evidence page proves this What changed this version state?
The agent.yaml schema
What it is
The agent.yaml schema is an advanced reference for users who want to edit an agent spec directly in code.
Value to users
It gives advanced builders one readable YAML file that can represent Configure governance, Flow graph wiring, runtime posture, and saved draft metadata without silently collapsing the agent into a prompt-only file. If you are setting up your first agent, start with Configure instead.
Use it when
- Review every saved field for an agent in one place.
- Edit a spec-heavy change faster than clicking through Configure sections.
- Confirm Flow, Pro, and Configure are rendering the same saved draft.
- Check whether a YAML edit maps to a Configure section before saving.
Next safe action
Use this only when you want code-level control. Otherwise start in Configure. If editing YAML, open Pro, load agent.yaml, edit the section that matches Configure, save the draft, then switch back to Configure or Flow to verify the same field rendered there.
Options and features
| Option | What it does | Value it adds | How to use it |
|---|---|---|---|
| name, slug, description | Define the visible agent record. | Keeps Fleet, Agent Cockpit Configure, Flow, and Pro labels aligned. | Use strings. Slug means a short URL-safe identifier, for example review-canary. |
| identity | Stores mission, serves_who, company_creator_context, role_jurisdiction, tone_style, rules_values, trust_risk, decision_framework, definition_of_done, escalation, and memory_intent. | Maps to Configure's Identity section. | Use strings for each field; empty strings mean the identity field is not yet authored. |
| instructions | Stores system, role, behavior_rules, tone_voice, output_format, refusal_rules, escalation, examples, and test_draft_prompt. | Maps to Instructions / Behavior and feeds the compiled prompt preview. | Use strings for prompt fields and a list of strings or structured examples for examples. |
| io_contract | Stores accepted_inputs, output_contract, input_examples, required_context, validation_rules, output_destination, failure_behavior, and max_input_chars. | Maps to Inputs & Outputs, with max_input_chars mirrored through Safety. | Use lists for multi-row fields and strings for the contract, destination, and failure behavior. |
| model | Stores approved Gateway route fields plus safe generation overrides such as temperature, max_tokens, response_format, reasoning_effort, verbosity, summary_mode, streaming, and stop_sequences. | Maps to Speed & Cost and Flow's Agent node. Gateway owns provider, model, fallback, budget, and health details. | Use route_alias / route_id for Gateway assignment, temperature as a number, streaming as boolean, and stop_sequences as a string list. |
| skills | Stores enabled skills and allowed_integrations with optional per-integration approval policy. | Maps to Tools & Skills and controls what Tool nodes may expose. | Use enabled as a list of skill slugs and allowed_integrations as objects like { id, approval }. |
| knowledge | Stores sources, files, retrieval_mode, results, citations, freshness, relationship_map, when_missing, and memory. | Maps to Knowledge & Memory and informs Knowledge node policy summaries. | Use memory.enabled as boolean, memory.retention_days as number, and citations/freshness values as product labels. |
| triggers | Stores type, label, cron, timezone, scheduled_input, webhook_secret, queue_name, protocol endpoint, stream URL, auth reference, ACP metadata, ANP DID, and event schema. | Maps to Triggers & Intake and Start node trigger awareness. | Use type values manual_only, schedule, webhook, queue, a2a, agui, acp, or anp; cron/timezone apply to schedule, ACP/ANP use discovery metadata, and AG-UI uses stream/schema fields. |
| approvals | Stores default_email, default_sms, default_webhook, web_push_stub, and schema fields for triggers, reviewer, timeout, expiry_behavior, and escalation_chain. | Maps to Approvals and human-review defaults. | Use delivery targets as strings, web_push_stub as boolean, timeout as seconds, and escalation_chain as a string list. |
| safety | Stores max_input_chars, blocked_behavior, escalation_framing, deny_by_default_tool_usage, and audit_logging_on_blocked_tools. | Maps to Safety and the Guardrails block agent-level banner. | Use max_input_chars as a number and booleans for deny-by-default or audit logging flags. |
| runtime | Stores budget_daily_usd, tool_allowlist, max_steps_per_run, max_duration_seconds_per_run, timeout_seconds, max_agent_steps, max_duration_seconds, retry_behavior, and reflection. | Maps to Runtime and the Agent node policy strip. | Use numbers for limits, a string list for tool_allowlist, and reflection as an object with enabled/cadence/loop strategy fields. |
| alerts, quality_evals, self_improve | Store lifecycle thresholds, evaluation rules, release gates, learning cadence, rollback, and approval mode. | Maps to Alerts, Quality / Evals, and Self-improvement. | Use numeric thresholds for alert/eval limits, booleans for gates, and strings for cadence or policy names. |
| source_sync | Stores repository, base_branch, and repo_path. | Documents the Source Sync relationship in the same YAML file. | Use repository as owner/name, base_branch as a branch name, and repo_path as the agent folder or file path. |
| flow | Stores nodes and edges in the same shape the Flow Builder serializes. | Makes Pro the raw lens for graph wiring, not just governance fields. | Use nodes and edges arrays; each node keeps its id, type, position, and data object. |
| JSON Schema | Publishes the machine-readable reference for this YAML shape. | Gives Pro save-time validation and external tooling one shared contract. | Open /schemas/agent.schema.json from the app host, or open the read-only agent.schema.json file in the Pro file tree. |
| Validation and round-trip safety | Blocks invalid agent.yaml saves and warns when a saved spec has fields Pro cannot fully represent yet. | Pro should never silently drop data just because another surface or a future version wrote a field first. | Fix the schema error shown above the editor, or switch to Configure when the warning lists fields not yet representable in Pro. |
Basic workflow
- 1Open Studio and switch to Pro.
- 2Open agent.yaml for the selected agent draft.
- 3Find the top-level section that matches the Configure section you would otherwise edit.
- 4Make the YAML change and save.
- 5Switch to Configure or Flow and confirm the same field rendered there.
- 6Publish only after the draft has been reviewed and tested.
Proof that it worked
- agent.yaml includes identity, instructions, io_contract, model, skills, knowledge, triggers, approvals, safety, runtime, alerts, quality_evals, self_improve, source_sync, and flow.
- Editing a Pro field updates the matching Configure-facing spec key on save.
- Unrelated saved spec fields survive a Pro round trip.
- The JSON Schema reference is available at /schemas/agent.schema.json and as read-only agent.schema.json in Pro.
- Invalid agent.yaml saves show an actionable schema error and do not create a new version.
- Specs with not-yet-representable fields show a warning and preserve those fields on save.
Before you start
- Confirm you are on /studio and looking at the right workspace.
- Read visible status, warning, or empty-state text before clicking an action.
- If the page shows IDs, copy the relevant agent, run, onboarding, or request ID before switching pages.
If you get blocked
- If this section feels too raw, use Agent Configure first; YAML is for users editing specs directly in code.
- If a field is rejected, run a dry-run apply or compare the matching Configure section before changing production config.
- If a slug fails validation, use a short URL-safe identifier such as support-triage.
Useful Thomas questions
- Should I edit YAML directly or use Configure?
- Which YAML fields map to approvals and tool access?
- Why did this agent spec fail validation?
Loading existing agents into the builder
What it is
Load agent opens an existing workspace agent in Flow or Pro without creating a new record first.
Value to users
It lets builders move from Fleet or Configure back into Studio, keep the same agent ID across Flow and Pro, and decide when to duplicate instead of editing the original.
Use it when
- Open an existing agent from a blank Flow canvas.
- Open an existing agent.yaml from a blank Pro editor.
- Switch Flow -> Pro -> Flow without losing the selected agent.
- Fork a safe copy before experimenting with a risky spec change.
Next safe action
Click Load agent, choose the row you want, then confirm the URL includes agentId before editing or saving.
Options and features
| Option | What it does | Value it adds | How to use it |
|---|---|---|---|
| Load agent | Lists workspace agents with name, slug, status, latest draft version, and last-edited time. | Keeps builders from having to start in Fleet or Configure just to reopen existing work. | Use the search box when the workspace has more than ten agents, then click a row to load that agent into the current builder. |
| Edit in place | Loads the latest editable draft for the selected agent. | Saving in Flow or Pro updates the same agent rather than silently creating another one. | Use this when the intent is to continue work on the current agent. The URL will include agentId so tab switches keep context. |
| Duplicate as new agent | Deep-copies the current spec into a new agent ID and opens that new agent in the active builder. | Protects the original when a builder wants to experiment. | Open the row menu and choose Duplicate as new agent. The new agent starts at v1 and the toast names the source slug and version. |
| Shared builder context | Stores the selected agent in Studio-level state and in the URL as agentId. | Flow and Pro behave like two views of the same agent instead of separate products. | After loading an agent, switch between Flow, Pro, Vibe, or Import. The agentId remains in the URL on each Studio tab. |
| Version badge | Shows the latest saved spec version available to edit. | Gives builders a quick check that they opened the expected revision. | Use the v-number as a draft reference. Separate read-only live-snapshot opening will appear when draft/live promotion controls are added. |
Basic workflow
- 1Open /studio?v=flow or /studio?v=pro.
- 2Click Load agent.
- 3Search if the workspace list is long.
- 4Click the agent row to edit the latest draft in place.
- 5Use the row menu and Duplicate as new agent when you want a fork instead.
- 6Switch between Flow and Pro and confirm agentId stays in the URL.
Proof that it worked
- Load agent is visible in both Flow and Pro headers.
- Rows show name, slug, status, v-number, and last-edited time.
- Selecting a row updates the URL with agentId.
- Switching Flow -> Pro -> Flow keeps the same agentId.
- Duplicate as new agent creates a separate agent and leaves the original unchanged.
Before you start
- Confirm you are on /studio and looking at the right workspace.
- Read visible status, warning, or empty-state text before clicking an action.
- If the page shows IDs, copy the relevant agent, run, onboarding, or request ID before switching pages.
If you get blocked
- If the page is empty, check whether filters, scope, or time window are hiding the data.
- If an action is locked, follow the visible lock reason before trying another route.
- If Loading existing agents into the builder does not answer the question, open the linked evidence page instead of guessing.
Useful Thomas questions
- Based on the visible state, what is the next safe action?
- Which status, warning, or ID should I verify first?
- Which linked evidence page proves this Loading existing agents into the builder state?
How Flow blocks reflect agent-level policy
What it is
Flow block policy banners explain which Configure-owned agent settings apply to a canvas block.
Value to users
They keep Flow honest as a wiring lens: builders can see governance that affects the run without editing Configure-only controls from the canvas.
Use it when
- A Flow block appears read-only or filtered and you need to know why.
- You want to confirm which Configure section owns a policy before editing it.
- You are reviewing a flow and need the lifecycle or governance posture without leaving Studio.
Next safe action
Read the banner or policy panel on the selected block, then use its Configure deep link when the saved policy needs to change.
Options and features
| Option | What it does | Value it adds | How to use it |
|---|---|---|---|
| Start node trigger policy | Shows the saved Triggers & Intake type, label, cron, timezone, scheduled run input, protocol endpoint, stream URL, ACP metadata, ANP DID, and next-run preview. | A scheduled agent no longer looks manual just because the Flow canvas owns wiring rather than intake. | Select the Start node, open Advanced, then use Edit in Triggers & Intake to change schedule, webhook, queue, A2A, AG-UI, ACP, or ANP settings. |
| Agent node compiled prompt | Shows the merged Instructions / Behavior fields as one read-only prompt preview above the node-level system prompt editor. | Builders can see Configure-authored behavior rules, tone, output format, refusals, escalation, and examples before editing the local prompt. | Select an Agent node, open Prompt, then use Edit in Instructions / Behavior when the saved behavior brief needs to change. |
| Agent node runtime strip | Shows Budget limit, Timeout seconds, Max agent steps, Max duration, Retry behavior, and Reflection state. | Runtime caps stay visible on the reasoning block that will be constrained by them. | Select an Agent node on the Settings tab, then use Edit in Runtime to change caps or reflection settings. |
| Tool node Skills & integration banner | Shows the enabled-skill count, allowed-MCP count, and a Tools & Skills deep link before a Tool node is wired. | Builders can tell whether an empty picker means no approved skills, not a broken canvas. | Select a Tool node, choose Skill or Connected MCP, then use Open Tools & Skills to change which capabilities the agent may call. |
| Knowledge node retrieval policy | Shows Citations mode, Freshness, Relationship map, Run-to-run memory, Memory retention days, and When sources missing. | Knowledge blocks reveal the source and memory rules that Configure owns, while Flow keeps local retrieval wiring editable. | Select a Knowledge node, read the Knowledge policy panel, then use Edit in Knowledge & Memory to change source, citation, freshness, graph, or memory rules. |
| Guardrails node safety banner | Shows deny-by-default tool usage, max input characters, and audit logging on blocked tools. | Disabling a node-level check such as Moderation does not remove the agent-level Safety policy that still applies to every run. | Select a Guardrails node, read Agent-level safety, then use Edit in Safety to change max input limits or blocked-tool behavior. |
| Output node contract panel | Shows Accepted inputs, Output contract, Validation rules, Output destination, and Failure behavior. | Output blocks reveal the Configure-owned contract that decides whether a result is acceptable before it leaves Zahara. | Select an Output node, read Output contract, then use Edit in Inputs & Outputs to change accepted inputs, destinations, validation, or fallback behavior. |
| Canvas lifecycle policy strip | Shows alert thresholds, Quality/Evals pass threshold and cadence, and Self-improvement state at the top of the Flow canvas. | A builder can see the agent's lifecycle posture at a glance before inspecting individual blocks. | Use the Alerts, Quality / Evals, or Self-improvement line to jump to the Configure section that owns the policy. |
| Read-only by design | Separates wiring edits from governance edits. | Flow can show the policy in force without creating a second place to mutate triggers, approvals, alerts, or safety. | Use Flow for graph structure. Use Configure for agent-level policies. The deep link names the exact Configure section. |
| Guide link | Opens this reference in an in-context side panel from the policy panel. | A builder can learn why a field is read-only without guessing or leaving the review trail cold. | Click the Guide question-mark button next to a Flow policy banner or panel title. |
Basic workflow
- 1Open Studio with an agent selected.
- 2Select a Flow block that has a policy panel.
- 3Read the policy values before changing wiring.
- 4Click the Configure deep link when the saved policy needs editing.
- 5Return to Flow and reload or reselect the agent to confirm the policy summary changed.
Proof that it worked
- Start node Advanced shows Triggers & Intake instead of Soon placeholders.
- Scheduled agents show cron, timezone, scheduled input, and next-run preview; protocol agents show A2A, AG-UI, ACP, or ANP endpoint details.
- The Start node policy panel links to /agents/[id]?tab=configure§ion=schedule.
- Agent node Prompt shows a compiled Instructions / Behavior preview with a Configure deep link.
- Agent node Settings shows runtime caps and reflection state with a Runtime deep link.
- Tool node Settings shows enabled skills, allowed MCPs, and an Open Tools & Skills link to /agents/[id]?tab=configure§ion=skills.
- Tool node skill options that are not enabled for the agent are disabled with Enable in Tools & Skills guidance.
- Knowledge node Settings shows citation, freshness, relationship map, memory, retention, and missing-source behavior.
- Knowledge node policy links to /agents/[id]?tab=configure§ion=knowledge-graph.
- Guardrails node Settings shows the agent-level Safety banner and links to /agents/[id]?tab=configure§ion=guardrails.
- The Safety banner remains visible when node-level Moderation or PII checks are disabled.
- Output node Settings shows accepted inputs, output contract, validation rules, destination, and failure behavior.
- Output node contract policy links to /agents/[id]?tab=configure§ion=io-contract.
- The canvas-level lifecycle strip appears below Fit to View and summarizes Alerts, Quality / Evals, and Self-improvement.
- The lifecycle strip links Alerts to /agents/[id]?tab=configure§ion=alerts and Quality / Self-improvement to /agents/[id]?tab=configure§ion=quality-evals.
- The lifecycle strip can be dismissed without changing the saved agent spec.
- Policy Guide buttons open the Flow policy Guide in a side panel without navigating away from Studio.
- Flow does not add write controls for Configure-owned trigger policy.
Before you start
- Confirm you are on /studio and looking at the right workspace.
- Read visible status, warning, or empty-state text before clicking an action.
- If the page shows IDs, copy the relevant agent, run, onboarding, or request ID before switching pages.
If you get blocked
- If the page is empty, check whether filters, scope, or time window are hiding the data.
- If an action is locked, follow the visible lock reason before trying another route.
- If How Flow blocks reflect agent-level policy does not answer the question, open the linked evidence page instead of guessing.
Useful Thomas questions
- Based on the visible state, what is the next safe action?
- Which status, warning, or ID should I verify first?
- Which linked evidence page proves this How Flow blocks reflect agent-level policy state?
Inspect
What it is
Inspect is the evidence and governance context page for runs.
Value to users
It shows status, latency, cost, tokens, events, inputs, outputs, policy compliance, approval chain, tool/data access, risk, and linked audit evidence.
Use it when
- A run succeeded, failed, or needs review.
- You need to understand what happened during a run.
- You need cost, latency, event timeline, or request evidence.
- A reviewer needs to know whether a run is approved, needs review, or violates policy.
Next safe action
Open the run, check the governance badge, expand any failed policy, inspect tool and data access, then compare with Audit when trust matters.
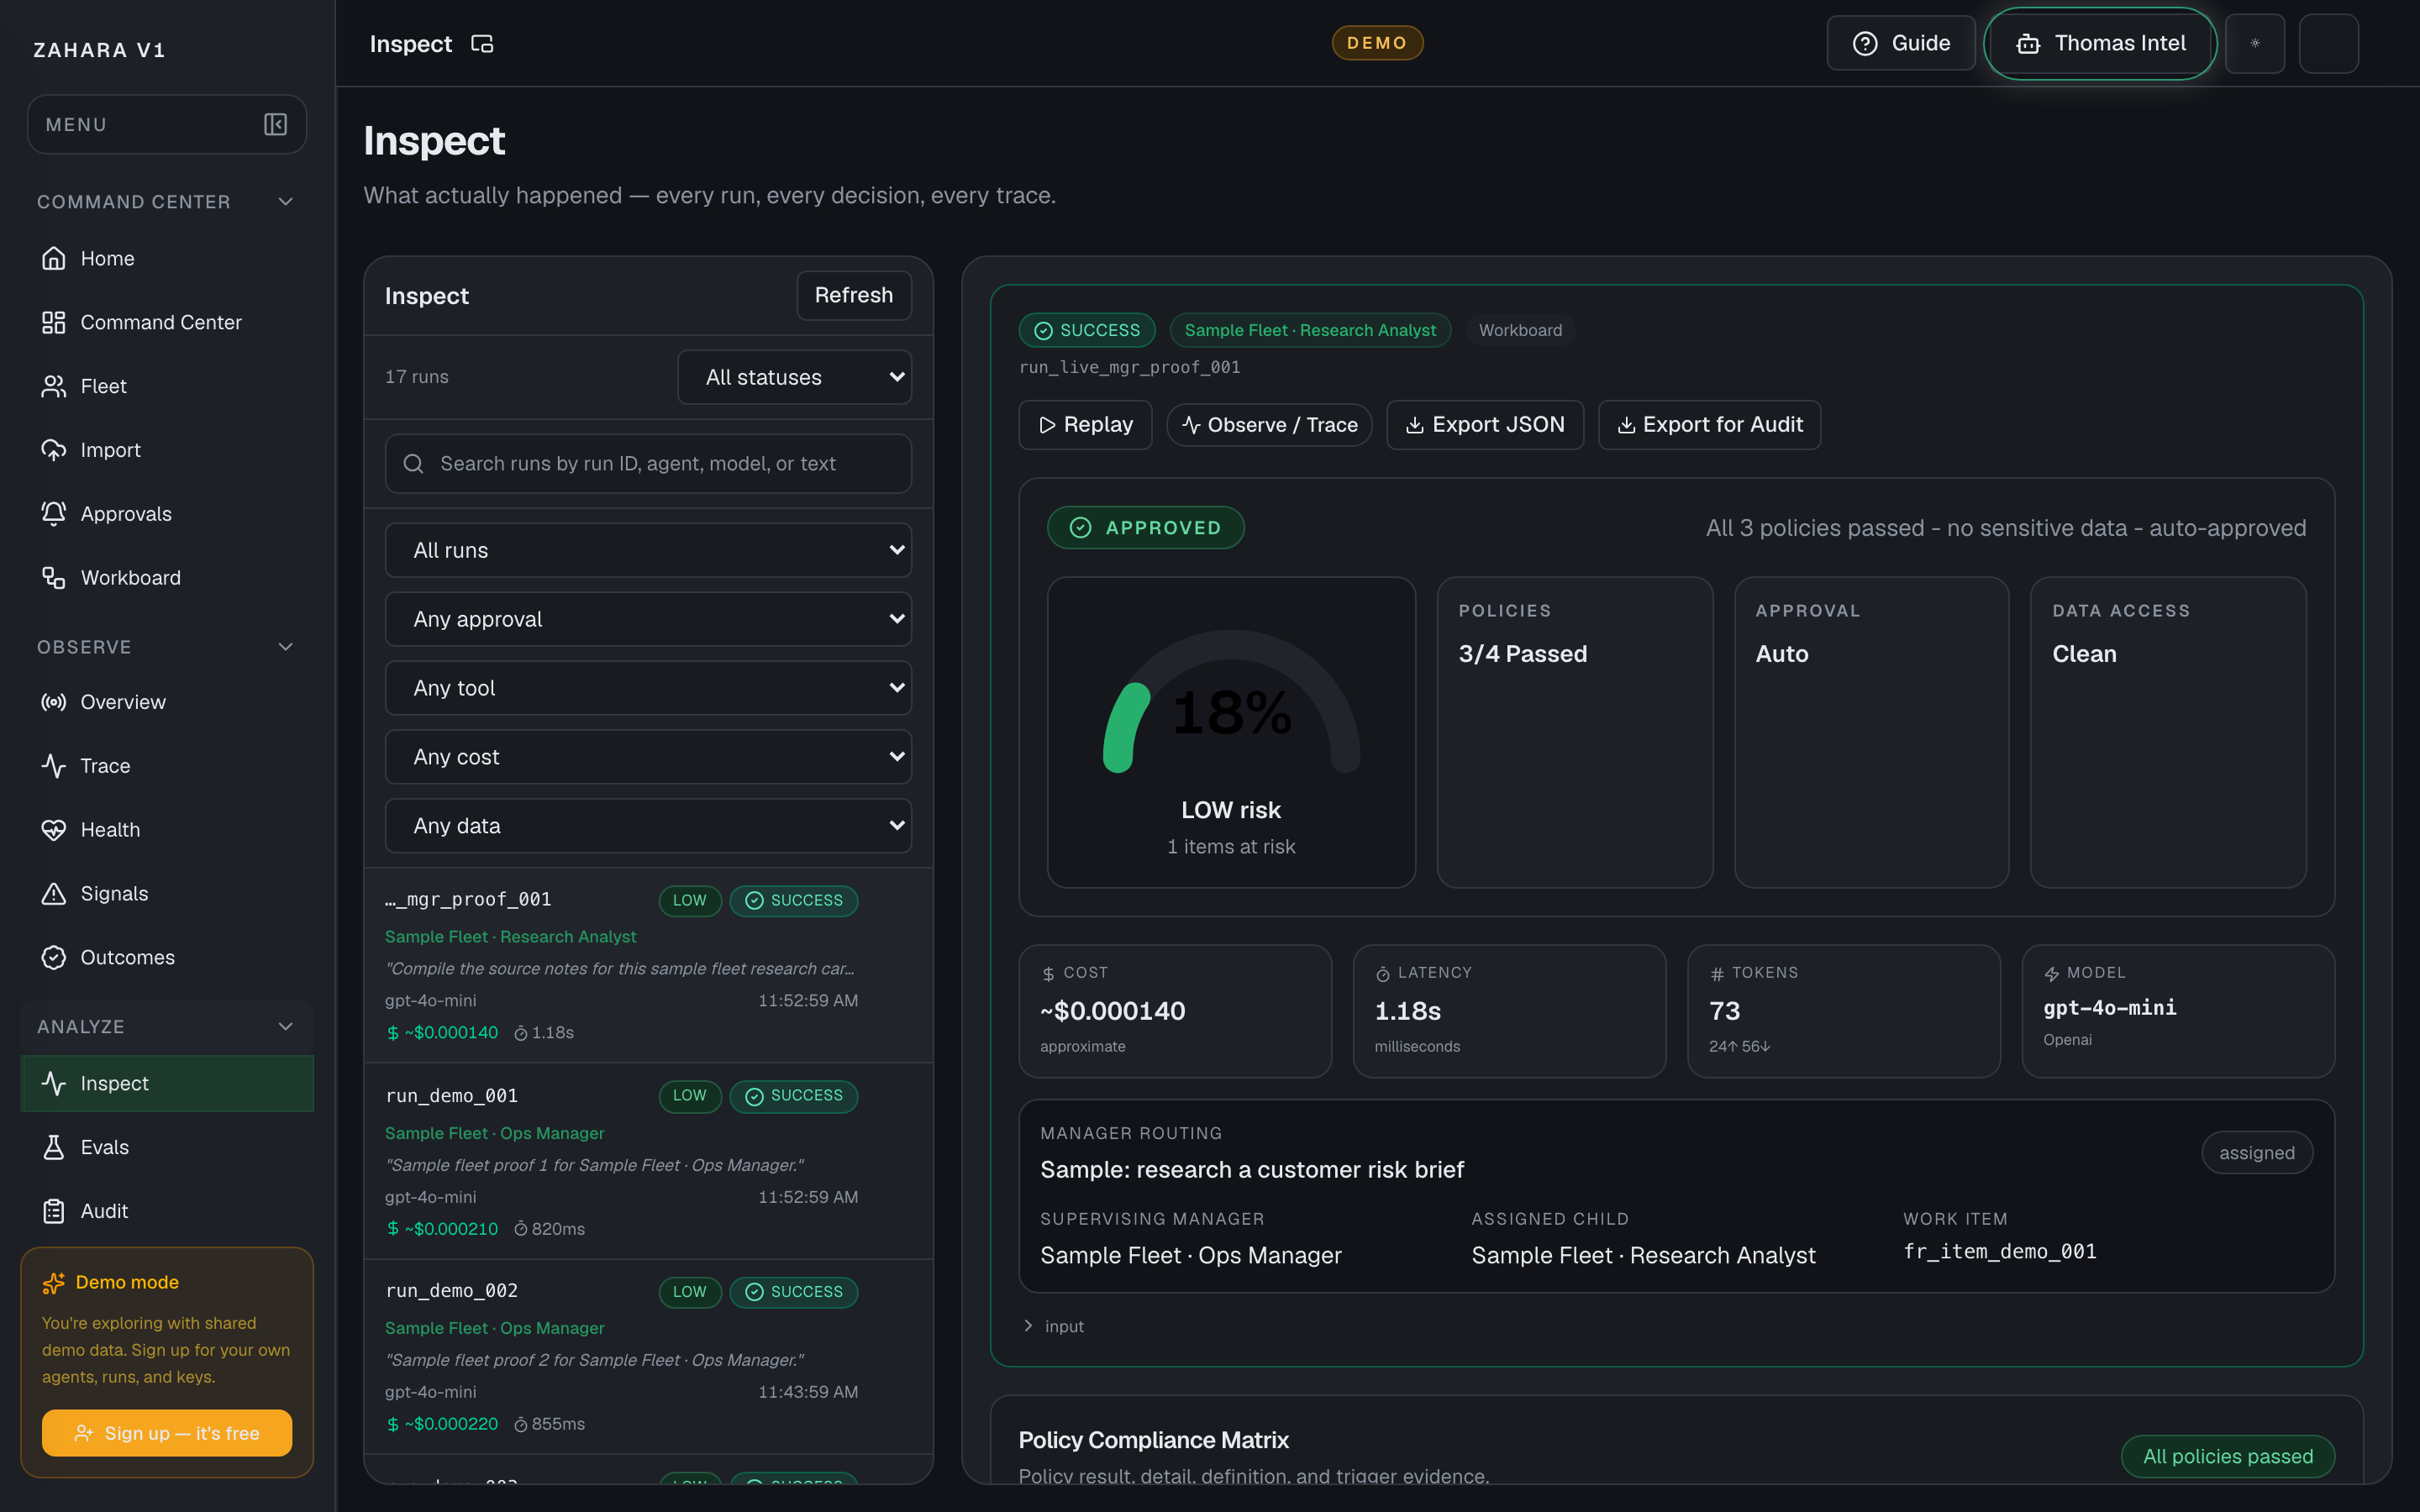
Options and features
| Option | What it does | Value it adds | How to use it |
|---|---|---|---|
| Run list | Lists recent or filtered runs. | Helps operators find the exact execution to inspect. | Filter by agent or run ID when possible. |
| Governance filters | Filters by policy result, approval type, tool, cost bucket, and data access. | Lets reviewers find high-risk evidence without reading every event row. | Combine filters, then clear active pills when the run list gets too narrow. |
| Risk badge | Shows Low, Medium, or High risk on every run row. | Keeps risk visible before the detail panel is open. | Hover the badge to see why cost, policy, data, or status drove the score. |
| Governance Summary Badge | Shows APPROVED, REVIEW NEEDED, or VIOLATION at the top of the run detail. | Gives compliance teams one first read before they inspect evidence. | Click the badge to jump to the Policy Compliance Matrix. |
| Policy Compliance Matrix | Lists pass, fail, or N/A rows for each policy that applies to the run. | Shows exactly which policy made the run clean or risky. | Expand any red row first, then compare the trigger evidence with Events and Audit. |
| Approval Chain Timeline | Shows run start, policy check, approval request or auto-approval, and completion. | Proves who or what allowed the run to proceed. | Read this before approving a retry or sharing run evidence with a customer. |
| Tool Usage & Data Access | Lists tool name, read/write action, source, PII flag, duration, and status. | Shows whether the run touched sensitive data or mutated an external system. | Open rows with write access or PII before treating the run as clean. |
| Export for Audit | Downloads the displayed run governance context as JSON. | Creates a portable compliance artifact without waiting for a backend export job. | Use it after verifying policy, approval chain, tool access, and audit context. |
| Timeline | Shows the ordered events for a selected run. | Explains how the run moved from start to finish. | Read from first event to terminal event before drawing conclusions. |
| Metrics | Shows latency, cost, token count, model, and status. | Makes performance and spend part of the trust decision. | Compare unusual values with Trace and Audit. |
| Linked audit evidence | Connects run evidence to tamper-evident events. | Proves that the inspectable run is recorded. | Open Audit when a customer, admin, or reviewer needs proof. |
Basic workflow
- 1Open the run by run ID or agent.
- 2Confirm the governance badge and run risk.
- 3Review the Policy Compliance Matrix and expand failing rows.
- 4Read the Approval Chain Timeline.
- 5Inspect Tool Usage & Data Access, especially PII or write access.
- 6Review metrics and event timeline.
- 7Export for Audit if the run needs portable compliance evidence.
- 8Open Trace for visual path if needed.
- 9Open Audit for tamper-evident proof.
Proof that it worked
- Run ID is stable.
- Status, latency, cost, tokens, and events are visible.
- Governance badge, policy matrix, approval chain, tool/data panel, risk badge, and filters are visible.
- Export for Audit downloads a JSON file for the selected run.
- Linked audit events exist for run start and run finish.
Before you start
- Confirm you are on /inspect and looking at the right workspace.
- Read visible status, warning, or empty-state text before clicking an action.
- If the page shows IDs, copy the relevant agent, run, onboarding, or request ID before switching pages.
If you get blocked
- If the page is empty, check whether filters, scope, or time window are hiding the data.
- If an action is locked, follow the visible lock reason before trying another route.
- If Inspect does not answer the question, open the linked evidence page instead of guessing.
Useful Thomas questions
- Based on the visible state, what is the next safe action?
- Which status, warning, or ID should I verify first?
- Which linked evidence page proves this Inspect state?
Evals
What it is
Evals is the quality intelligence layer for the agent fleet: policy-aware scorecard coverage, regression review, model comparison, test coverage, burndown, and quality evolution.
Value to users
It helps operators prove which agents are safe to trust, which ones are regressing, and where more tests are needed before release.
Use it when
- You need to see which agents have quality coverage.
- A prompt, tool, model, or policy changed and you need regression signals.
- You want to compare model quality or trace a regression back to config, model, or eval changes.
- You want scheduled eval cadence, alert history, and review-required events instead of manual scorecard checks.
Next safe action
Start with scorecard coverage, handle Active regressions, then open Scorecard Detail for the agent that needs proof or model comparison.
Related Guide pages
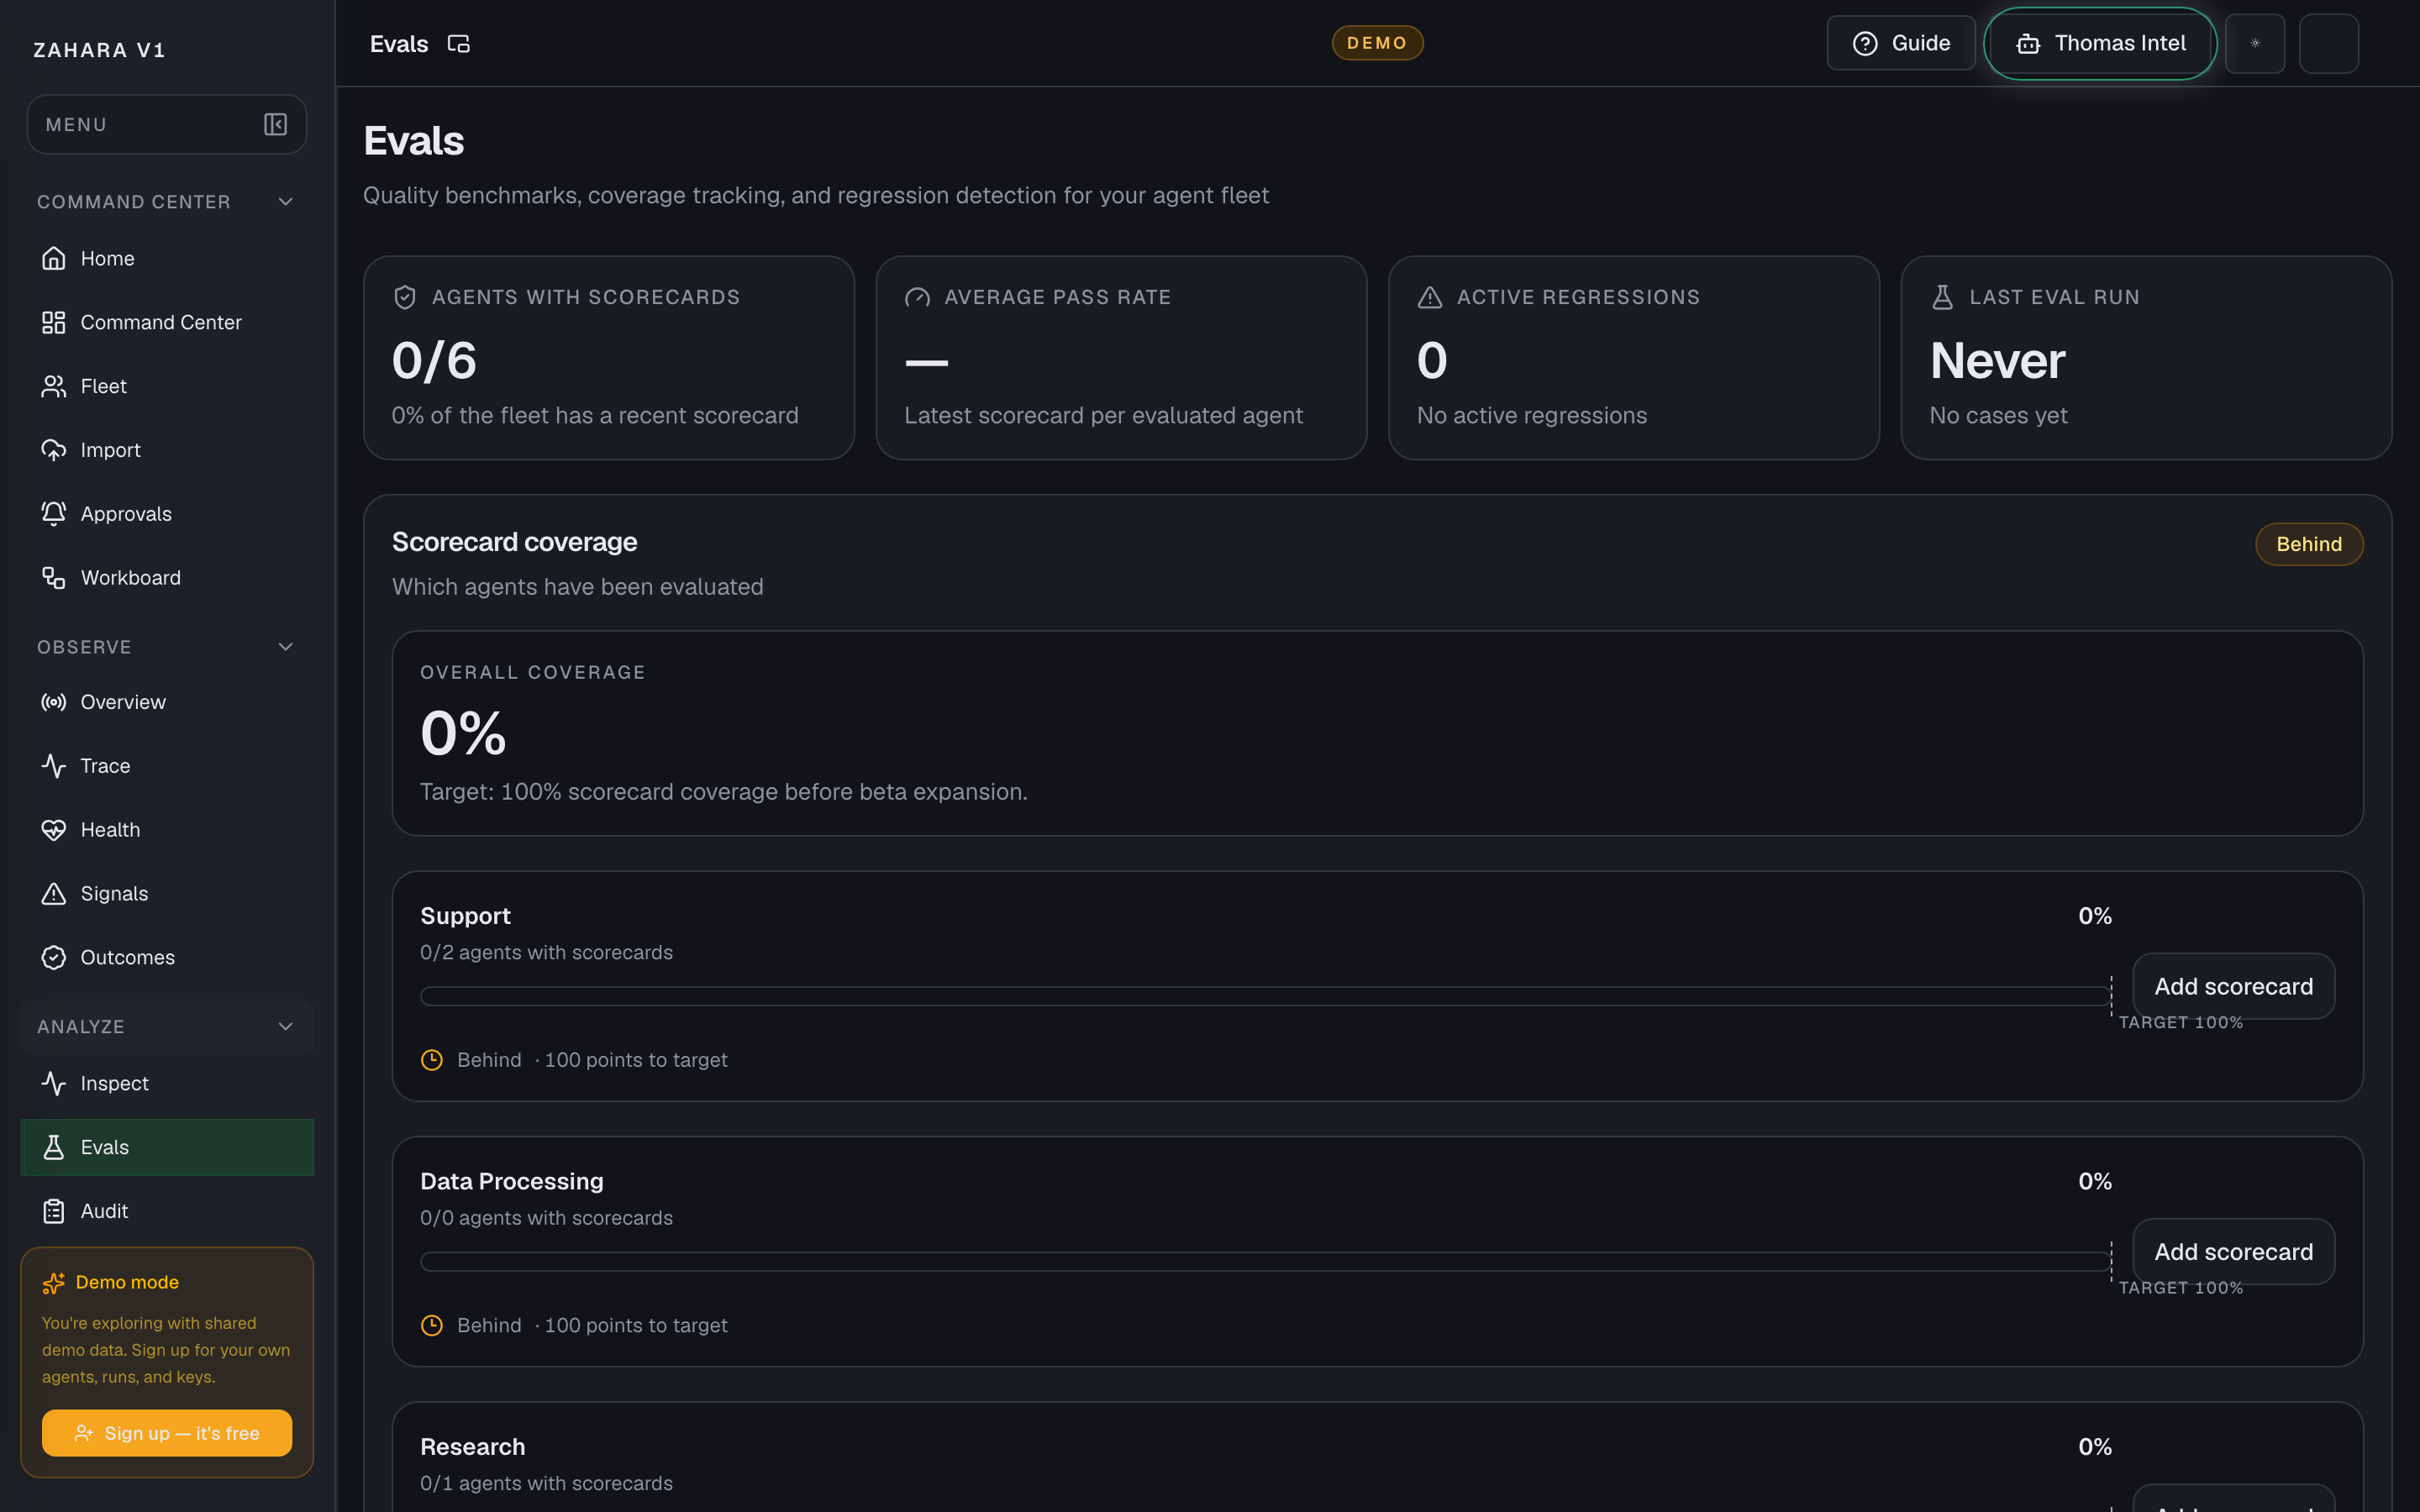
Options and features
| Option | What it does | Value it adds | How to use it |
|---|---|---|---|
| Scorecard coverage | Shows coverage progress by agent category with target markers and Add scorecard links into agent Quality / Evals. | Makes eval gaps visible before agents are promoted or demoed. | Fill sparse categories first by opening the suggested agent and creating a real eval pack. |
| Quality over time | Shows latest scorecard trajectory per scored agent against the configured target. | Turns eval results into a direction of travel, not just one score. | Click a line or trend pill to open Scorecard Detail. |
| Regression alerts | Shows backend-marked regressions with current score, target, gate gap, Investigate, Revert Config, Dismiss, and alert-rule support for eval.regressed. | Keeps quality failures from hiding in a row table. | Treat red cards as release blockers until Inspect or Audit explains them. |
| Scheduled evaluator | Runs due saved eval packs from the protected cron worker, caps queue depth, suppresses duplicate active evals, refreshes alert rules, and writes scheduler Audit events. | Turns eval policy into hands-free production governance instead of a manual checklist. | Set evaluation_frequency on the agent, attach a saved eval pack, then use Alert History or Audit to inspect scheduled results. |
| Coverage matrix and burndown | Shows scenario coverage from saved eval case metadata and progress toward 100% coverage. | Helps the team know whether eval work is on pace. | Use sparse cells to jump into agent Quality / Evals and add concrete cases with scenario_type metadata before trusting a category. |
| Quality timeline | Shows each scored agent's latest quality movement, last eval time, and event label. | Makes quality changes explainable without forcing reviewers to read a relationship graph. | Use it after a score changes to decide whether to inspect the run, audit config, or add more eval cases. |
Basic workflow
- 1Open Evals from Command Center or the Analyze nav group.
- 2Read overall coverage, configured policy count, stale cadence count, and active regression count.
- 3Open any regression card before lower-risk scorecards.
- 4Use Quality over time to choose the agent to inspect.
- 5Open Scorecard Detail, confirm threshold/cadence/release gate, run the saved eval pack if needed, compare model versions, then use Audit for config-change proof.
- 6Create eval.regressed and eval.stale alert rules so the scheduled evaluator can page operators and create review-required Audit events.
- 7Use the matrix and burndown to jump into Quality / Evals and add missing cases.
Proof that it worked
- Coverage bars show category progress and target markers.
- Quality trajectory and backend-marked regression cards are visible when data supports them.
- Scorecard Detail shows policy target, cadence, release gate, stored history trends, scenario bars, test cases, Run evals now, Compare models, Inspect runs, and agent-level Audit proof.
- Backend release gates block live, scheduled, and retry runs when the configured scorecard is missing, stale, regressed, or below threshold.
- The scheduled evaluator writes eval.scheduled_run_created, eval.review_required, and eval.scheduler_completed Audit events.
- Completed test cases include case-level Audit proof links filtered to the exact eval_result entity.
- Test coverage matrix uses saved case metadata, and sparse or scored cells route into real eval work when possible.
- Alert rules can fire for eval.regressed and eval.stale, with alert_outbox and delivered_via evidence for email, SMS, webhook, or Slack attempts.
Before you start
- Confirm you are on /evals and looking at the right workspace.
- Read visible status, warning, or empty-state text before clicking an action.
- If the page shows IDs, copy the relevant agent, run, onboarding, or request ID before switching pages.
If you get blocked
- If the page is empty, check whether filters, scope, or time window are hiding the data.
- If an action is locked, follow the visible lock reason before trying another route.
- If Evals does not answer the question, open the linked evidence page instead of guessing.
Useful Thomas questions
- Based on the visible state, what is the next safe action?
- Which status, warning, or ID should I verify first?
- Which linked evidence page proves this Evals state?
Observe
What it is
Observe is the front door for runtime health, risk, and investigation routing.
Value to users
It gives teams a live first read on run volume, warning pressure, and noisy agents before they choose the deeper observability page.
Use it when
- You want the fastest read on what needs attention right now.
- A new operator needs a clean way into observability.
- You need to choose between Signals, Health, and Trace before going deeper.
Next safe action
Start with Signals if you need a next-action queue, Health if you need a stability check, or Trace if you are already following one run.
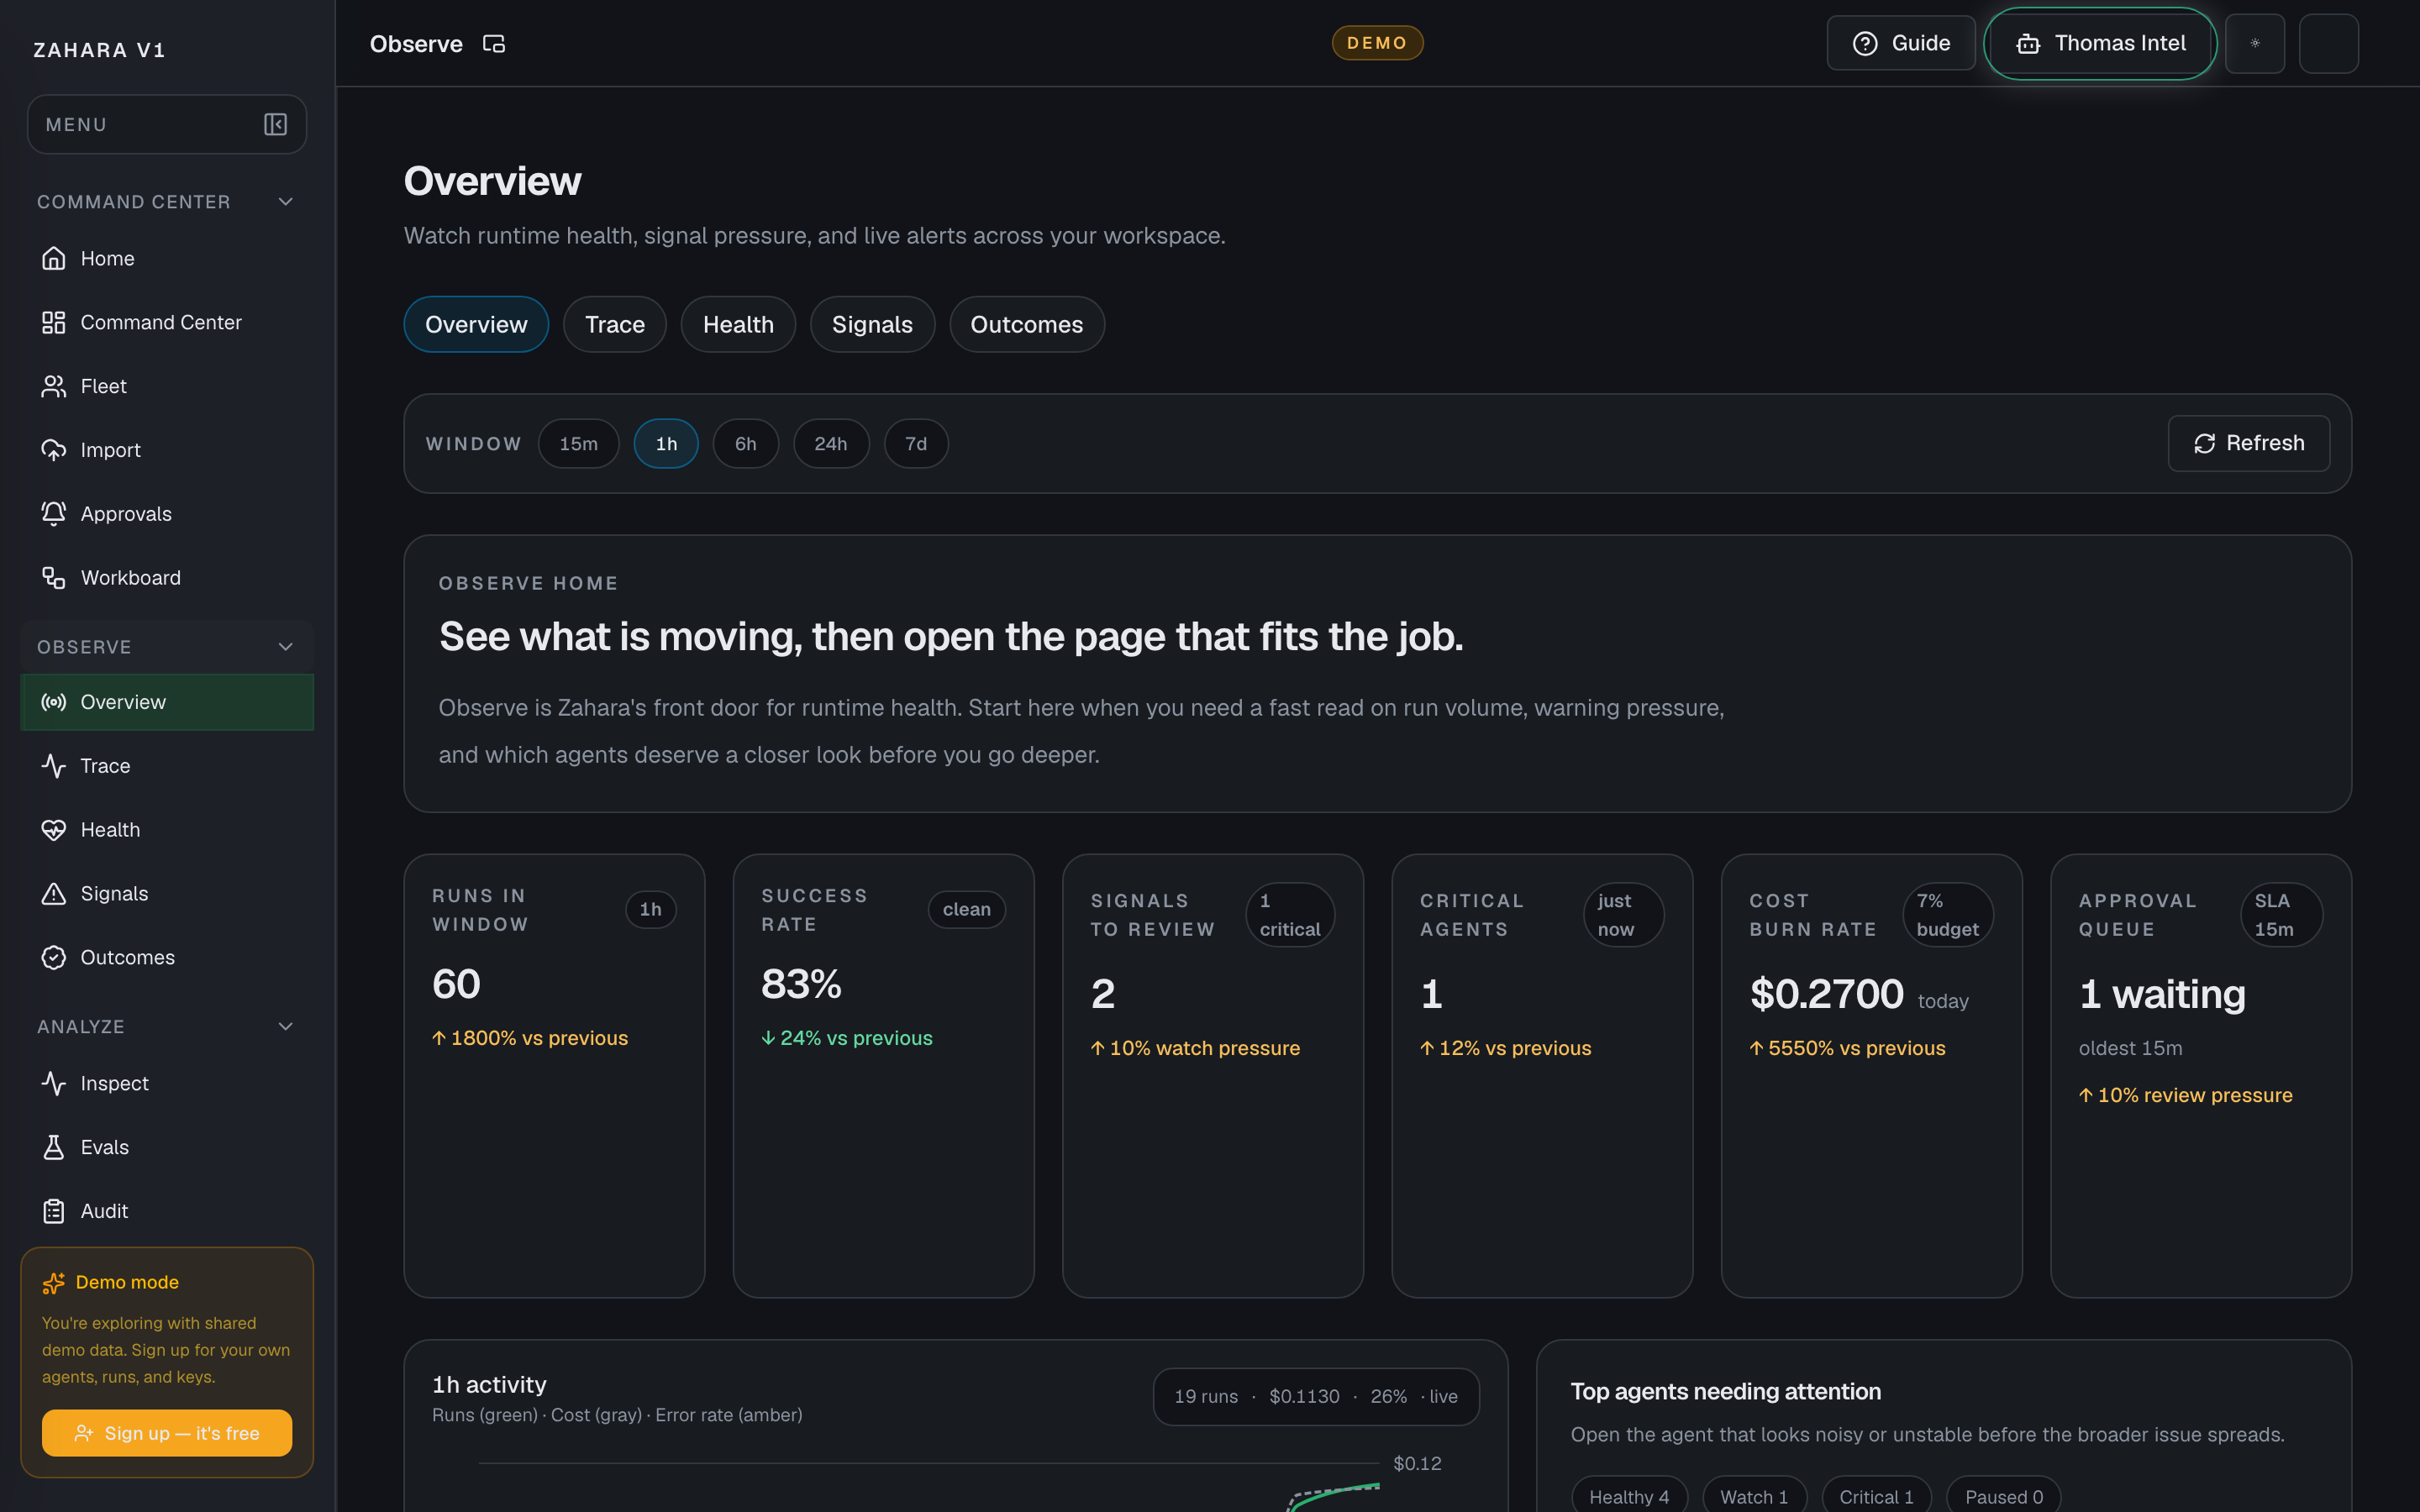
Options and features
| Option | What it does | Value it adds | How to use it |
|---|---|---|---|
| Page pop-out | Launches a read-only Observe monitor for a second-screen runtime health wall from the app header. | Keeps warning pressure, noisy agents, activity, success rate, and critical-agent count visible while the operator investigates elsewhere. | Use the small pop-out icon beside the page title during live operations, then open Signals, Health, Trace, or the full app when the monitor shows drift. |
| Customize layout | Lets each browser reorder the Observe monitor cards and reset back to the default runtime wall. | Supports multi-monitor operator stations where one screen may prioritize KPIs, another may prioritize noisy agents, and another may prioritize the signal queue. | Open /observe/live, choose Customize layout, move cards up or down, and use Reset layout when you want the shared default again. |
| Live activity graph | Shows run volume, cost, and error rate for the selected window right on the Observe home page. | Lets teams see whether the workspace is quiet, active, or drifting before they click deeper. | Use the chart first when you need a fast read on what changed in the current window. |
| Top agents needing attention | Highlights the loudest or riskiest agents and links straight into their scoped Observe view. | Turns observability into a list of who to open first instead of forcing a blind hunt through Fleet. | Open the agent Observe link when one agent clearly looks noisier than the rest. |
| Observe home cards | Route the user to Signals, Health, or Trace based on the job at hand. | Keeps the Observe lane understandable for first-time operators after the live summary has set the context. | Use the card whose question matches what you need to decide next. |
| Current attention panel | Shows the top signals that deserve review right now. | Turns observability into a human-readable starting point instead of a chart wall. | Open the full signal queue if the warning list is growing or looks severe. |
| Live summary cards | Show recent runs, success rate, warning pressure, critical-agent count, cost burn rate, and approval queue age with sparklines. | Gives a fast trust check before users open a deeper page, including spend and review pressure. | Use the summary cards to decide whether the workspace looks calm or noisy. |
Basic workflow
- 1Open Observe when you need the best first route into runtime health.
- 2Use the page-title pop-out when Observe should stay visible on another screen.
- 3Use Customize layout on the monitor when this workstation needs a different card order.
- 4Read the sparkline summary cards, cost burn rate, approval queue, activity graph, and top-agent panel.
- 5Choose Signals, Health, or Trace based on the question you need answered.
- 6Move to the deeper page only after the Observe home points to the right lane.
Proof that it worked
- Summary cards load for the selected window, including Cost burn rate and Approval queue.
- The page pop-out opens the same runtime health story in a read-only auto-refreshing view.
- Customize layout reorders the Observe monitor for this browser and Reset layout restores the default.
- The live activity graph renders for the selected window.
- Top agents needing attention links into agent Observe pages.
- The page links clearly to Signals, Health, and Trace.
- Current attention explains whether the workspace is calm or needs review.
Before you start
- Confirm you are on /observe and looking at the right workspace.
- Read visible status, warning, or empty-state text before clicking an action.
- If the page shows IDs, copy the relevant agent, run, onboarding, or request ID before switching pages.
If you get blocked
- If the page is empty, check whether filters, scope, or time window are hiding the data.
- If an action is locked, follow the visible lock reason before trying another route.
- If Observe does not answer the question, open the linked evidence page instead of guessing.
Useful Thomas questions
- Based on the visible state, what is the next safe action?
- Which status, warning, or ID should I verify first?
- Which linked evidence page proves this Observe state?
Observe / Trace
What it is
Observe / Trace is the execution debugger for one run, with a swimlane timeline, token waterfall, latency bottleneck view, metadata, and error recovery context.
Value to users
It helps teams explain exactly what happened in one run: where time went, where tokens were spent, which event mattered, and what to do next when a run fails.
Use it when
- Understand a run visually.
- Debug a slow, expensive, failed, or surprising run.
- Compare the agent path with Inspect evidence.
- Choose one agent without leaving Trace first.
Next safe action
Choose a run, scan the timeline flags, open the slowest or most expensive event, then use the waterfall and latency chart before opening Inspect for deeper proof.
Options and features
| Option | What it does | Value it adds | How to use it |
|---|---|---|---|
| Agent picker | Lets users switch between all recent runs and one agent's recent runs from the page itself. | Makes it easy to focus Trace without hunting through Fleet first. | Use the Agent picker at the top of the page, then clear it to return to all agents. |
| Agent scope | Keeps the run list, actions, and scope card tied to one agent. | Lets operators compare recent runs for the same agent without losing cockpit context. | Pick one agent on the page or open Trace from an agent page, agent Observe tab, or any link that carries the agent ID. |
| Execution timeline | Shows Init, LLM Reasoning, Tool Execution, Response, and Error swimlanes with duration-sized bars. | Makes the run path obvious and highlights slowest and most expensive steps. | Click a bar to inspect payload, model, tool, approval, or error details. |
| Token waterfall | Shows system prompt, user input, tool request/result, and model response token accumulation. | Makes prompt waste and tool-result bloat visible. | Click a segment to highlight the matching timeline step. |
| Latency per step | Ranks major steps by duration and names the current bottleneck. | Tells the operator whether to tune model, tools, approvals, or infrastructure first. | Start with the bottleneck callout, then open the same event in the timeline detail panel. |
| Run metadata | Shows model, cost, tokens, latency, policy compliance, approval status, and copyable run ID. | Puts the governance facts next to the trace instead of hiding them in separate pages. | Use this before sending a run ID to Audit, Inspect, or a teammate. |
| Error context | Explains failed runs in plain English with recovery actions and a similar-errors link. | Keeps operators from staring at raw errors without a next move. | Use it when the policy badge or run status says violation or error. |
| Open Inspect | Moves from visual trace to detailed metrics and events. | Lets users verify what the trace implies. | Open Inspect when status, cost, latency, or event detail matters. |
Basic workflow
- 1Open Trace from a run, agent, or Workboard proof packet.
- 2Choose one agent if you want the run list to stay in that agent's lane.
- 3Confirm the metadata panel matches the run and agent you meant to inspect.
- 4Read the execution timeline and open the flagged step.
- 5Use the token waterfall and latency chart to decide what caused cost or delay.
- 6Open Inspect or Audit if the path needs deeper proof.
Proof that it worked
- Execution timeline has phase swimlanes and event bars.
- Slowest and most expensive steps are visually flagged when present.
- Token waterfall, latency chart, metadata, and event detail agree on the selected run.
- Error context appears when a failed run is selected.
Before you start
- Confirm you are on /observe/trace and looking at the right workspace.
- Read visible status, warning, or empty-state text before clicking an action.
- If the page shows IDs, copy the relevant agent, run, onboarding, or request ID before switching pages.
If you get blocked
- If the page is empty, check whether filters, scope, or time window are hiding the data.
- If an action is locked, follow the visible lock reason before trying another route.
- If Observe / Trace does not answer the question, open the linked evidence page instead of guessing.
Useful Thomas questions
- Based on the visible state, what is the next safe action?
- Which status, warning, or ID should I verify first?
- Which linked evidence page proves this Observe / Trace state?
Observe / Health
What it is
Observe / Health is the live readout for agent stability, speed, and load.
Value to users
It helps teams spot whether the workspace or one selected agent is healthy before individual runs turn into tickets.
Use it when
- Check if agents are staying healthy or starting to drift.
- Watch latency, token pressure, and workspace cost without opening every run.
- Start a daily operator check with one page instead of three.
Next safe action
Set the time window, scan the top health cards, then use the chart and agent attention list to decide what needs a closer look.
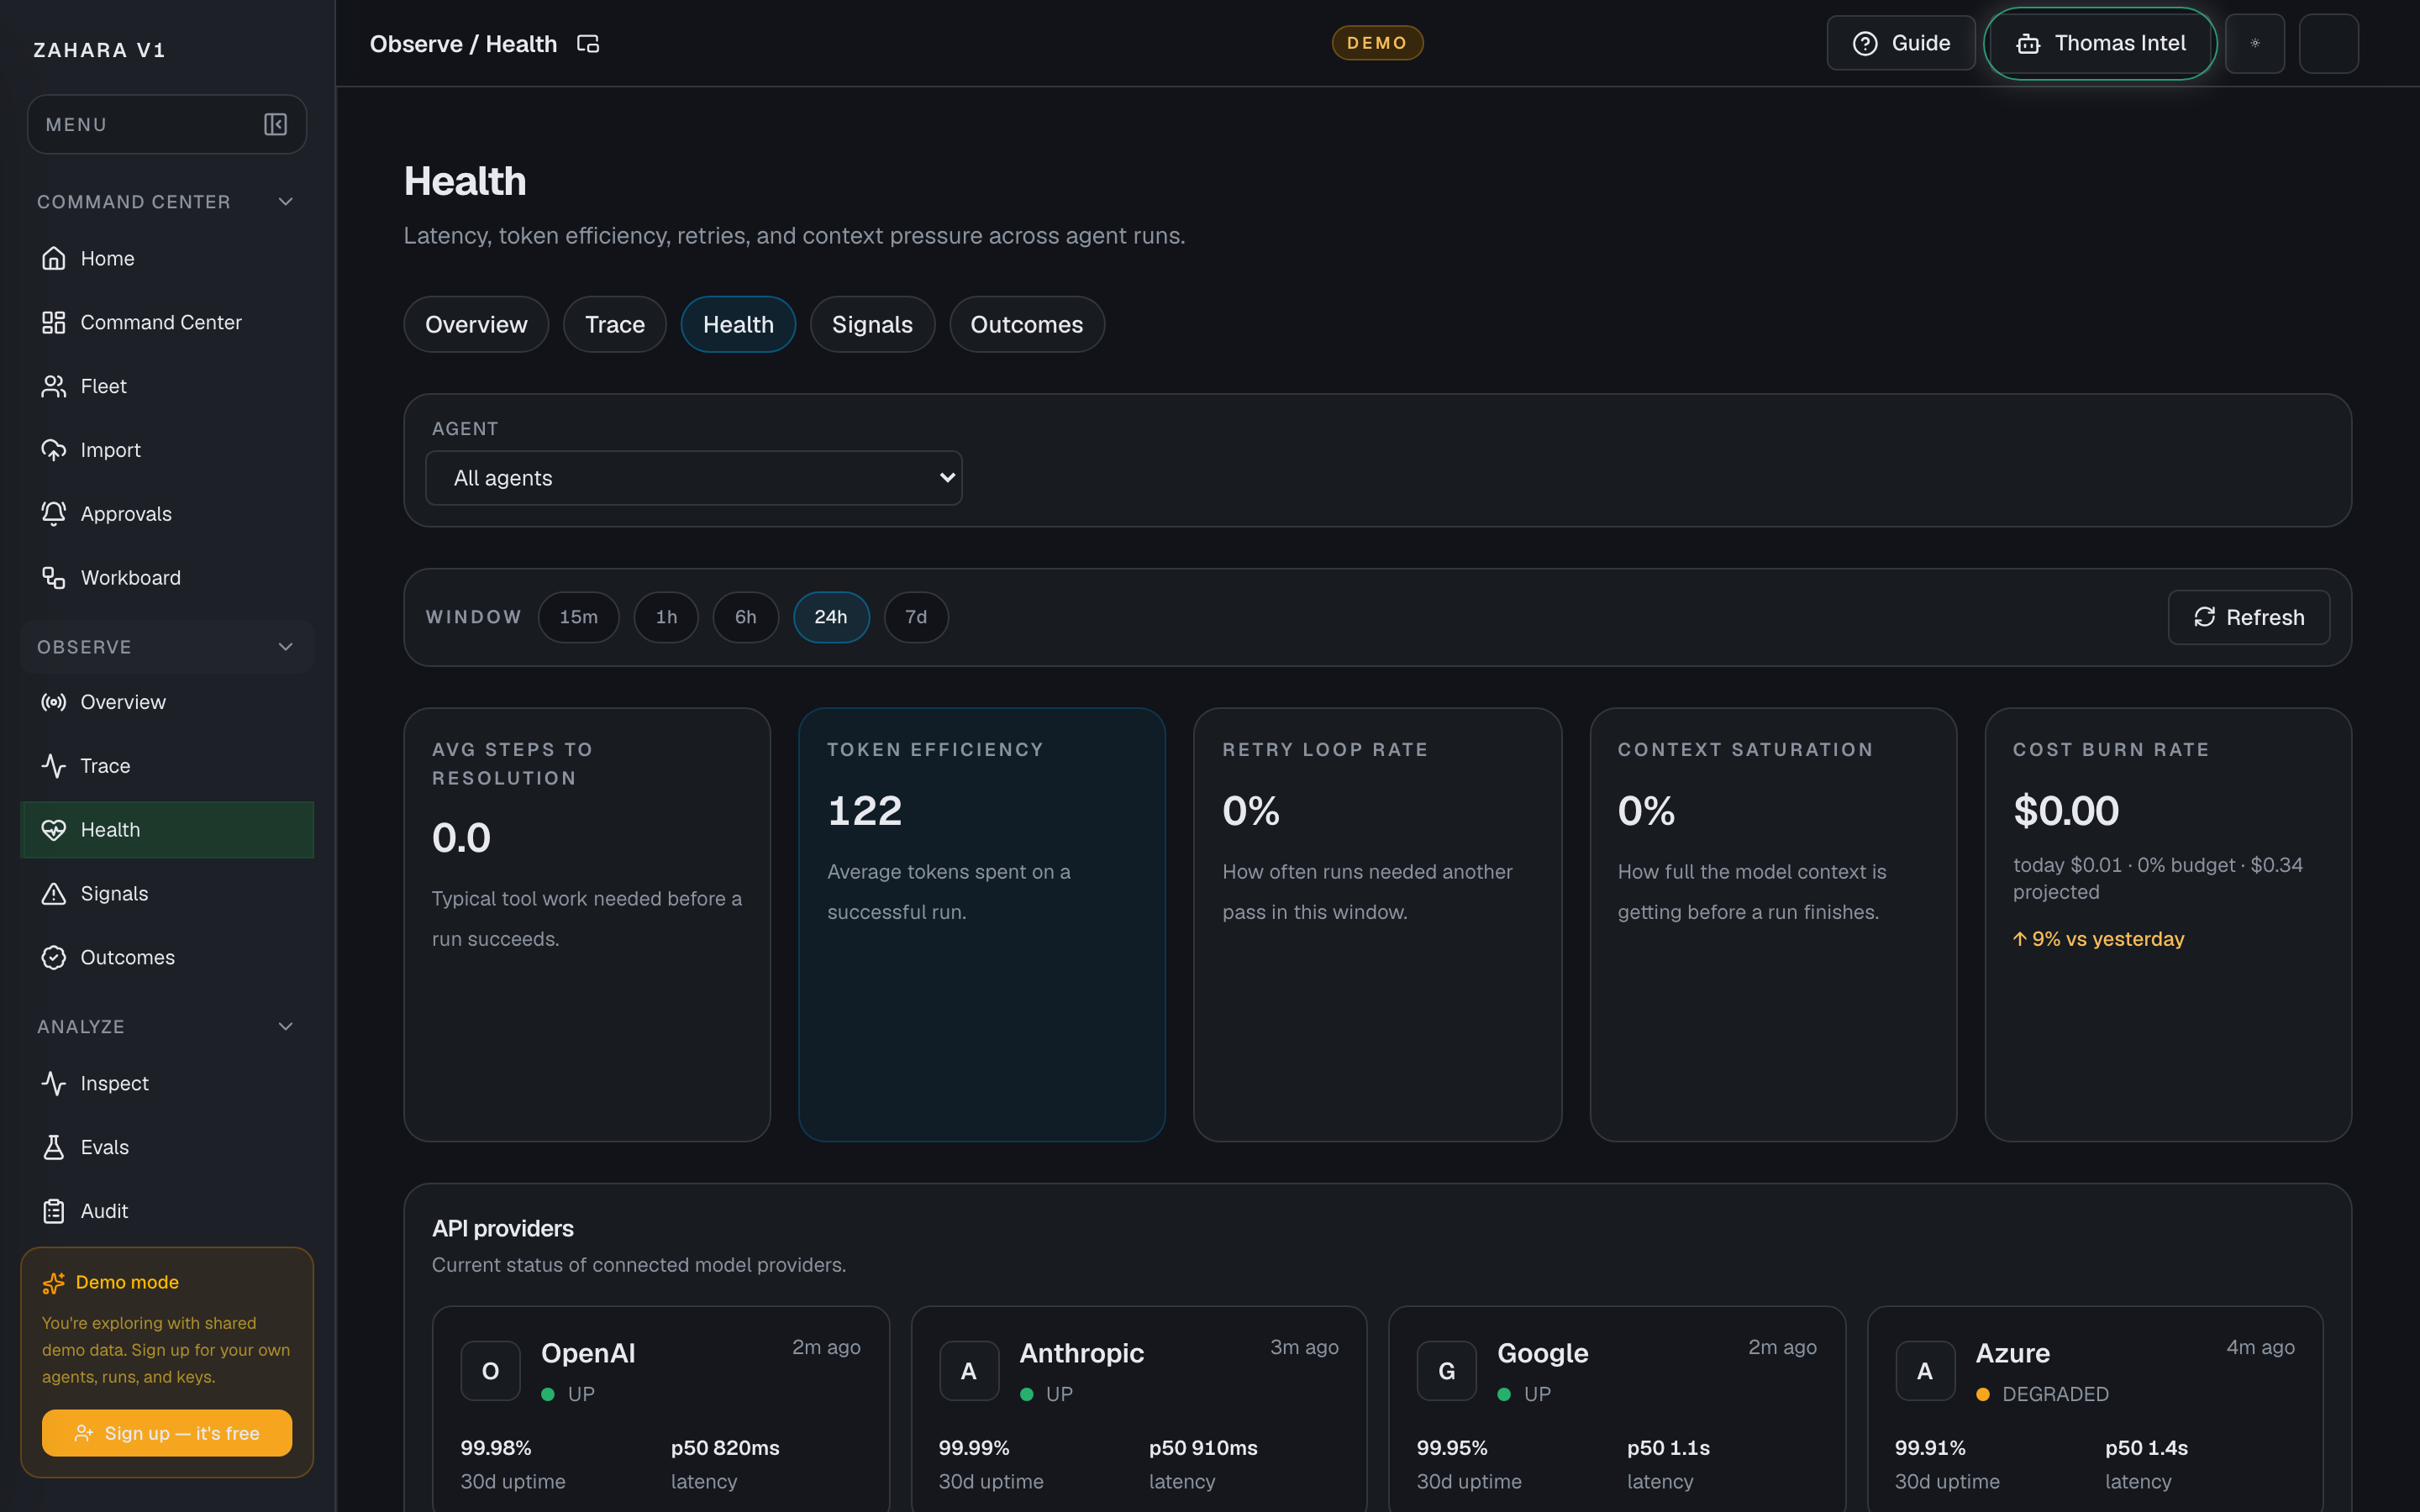
Options and features
| Option | What it does | Value it adds | How to use it |
|---|---|---|---|
| Agent filter | Switches the page between all agents and one selected agent. | Lets teams move from fleet-wide health to one noisy agent without leaving Observe. | Start on All agents, then click a cost bar or choose one agent when you need a tighter read. |
| Window | Changes the live slice used for health signals. | Lets users compare a recent spike with a calmer longer window. | Start short for active incidents, then widen if the pattern is unclear. |
| Efficiency cards | Summarize steps to resolution, token efficiency, retry loop rate, context saturation, and current cost burn. | Gives a fast read on whether work is getting heavier, loopier, more expensive, or closer to the context ceiling. | Scan these first before deciding whether the real problem is latency, cost, repeat work, or budget pressure. |
| API providers | Shows connected model providers with status, uptime, p50 latency, and the latest check time. | Separates a platform problem from an upstream provider issue. | Open the provider status page when a provider is degraded before changing agent config. |
| Data lineage checkpoints | Shows data sources, processing steps, outputs, and compliance checkpoints behind the Health view. | Helps reviewers understand where health metrics came from and where sensitive fields are governed. | Read the checkpoint rows when you need privacy, source, or output detail. |
| Latency breakdown | Splits average run time into model inference, tool execution, approval wait, and network or other time. | Names the largest bottleneck so the operator knows where to act first. | Use the bottleneck callout after TTFT to decide whether to tune model, tools, approvals, or infrastructure. |
| Tool performance | Ranks tools by success rate, trend, error count, average latency, and last error. | Replaces separate empty tool charts with one reliability table sorted worst-first. | Click a tool row to open Inspect filtered to that tool when success falls below the healthy range. |
Basic workflow
- 1Start with All agents and pick the smallest useful window.
- 2Read the efficiency and cost burn cards before chasing one chart.
- 3Check API providers to rule out upstream status before changing agents.
- 4Use the latency view toggle to decide whether the delay starts at first token or across the full run.
- 5Use the latency breakdown to identify the largest time sink.
- 6Click a cost bar or choose one agent when you need a tighter read.
- 7Use Tool performance when failures look tied to a connector or MCP server.
- 8Use Data lineage checkpoints when the question is where a metric came from or how sensitive data was handled.
Proof that it worked
- The agent filter changes the page scope without leaving Observe.
- The chart updates when the window changes or the agent filter changes.
- Cost burn shows hourly rate, daily total, budget percent, and projection.
- API provider cards show status, uptime, p50 latency, and external status links.
- Latency breakdown names the biggest bottleneck in the current window.
- Tool performance is sorted worst-first and each row links to Inspect.
- Data lineage checkpoints show sources, processing, privacy handling, outputs, and status.
- Cost, model, latency, and tool panels agree on which agent or tool path is carrying the pressure.
Before you start
- Confirm you are on /observe/health and looking at the right workspace.
- Read visible status, warning, or empty-state text before clicking an action.
- If the page shows IDs, copy the relevant agent, run, onboarding, or request ID before switching pages.
If you get blocked
- If the page is empty, check whether filters, scope, or time window are hiding the data.
- If an action is locked, follow the visible lock reason before trying another route.
- If Observe / Health does not answer the question, open the linked evidence page instead of guessing.
Useful Thomas questions
- Based on the visible state, what is the next safe action?
- Which status, warning, or ID should I verify first?
- Which linked evidence page proves this Observe / Health state?
Observe / Signals
What it is
Observe / Signals is the intelligence layer for warning pressure, retry loops, spend anomalies, failure causes, and escalation cost tradeoffs.
Value to users
It turns noisy telemetry into clear operator signals: what failed, what is looping, what got expensive, and whether approval gates are helping.
Use it when
- See when error rate is rising.
- Spot which agents are generating warning or critical signals.
- Decide whether to investigate now or keep monitoring.
Next safe action
Set the time window, clear any anomaly cards first, then use failure breakdown, spend calendar, retry loop callouts, and escalation-vs-cost to choose the next investigation.
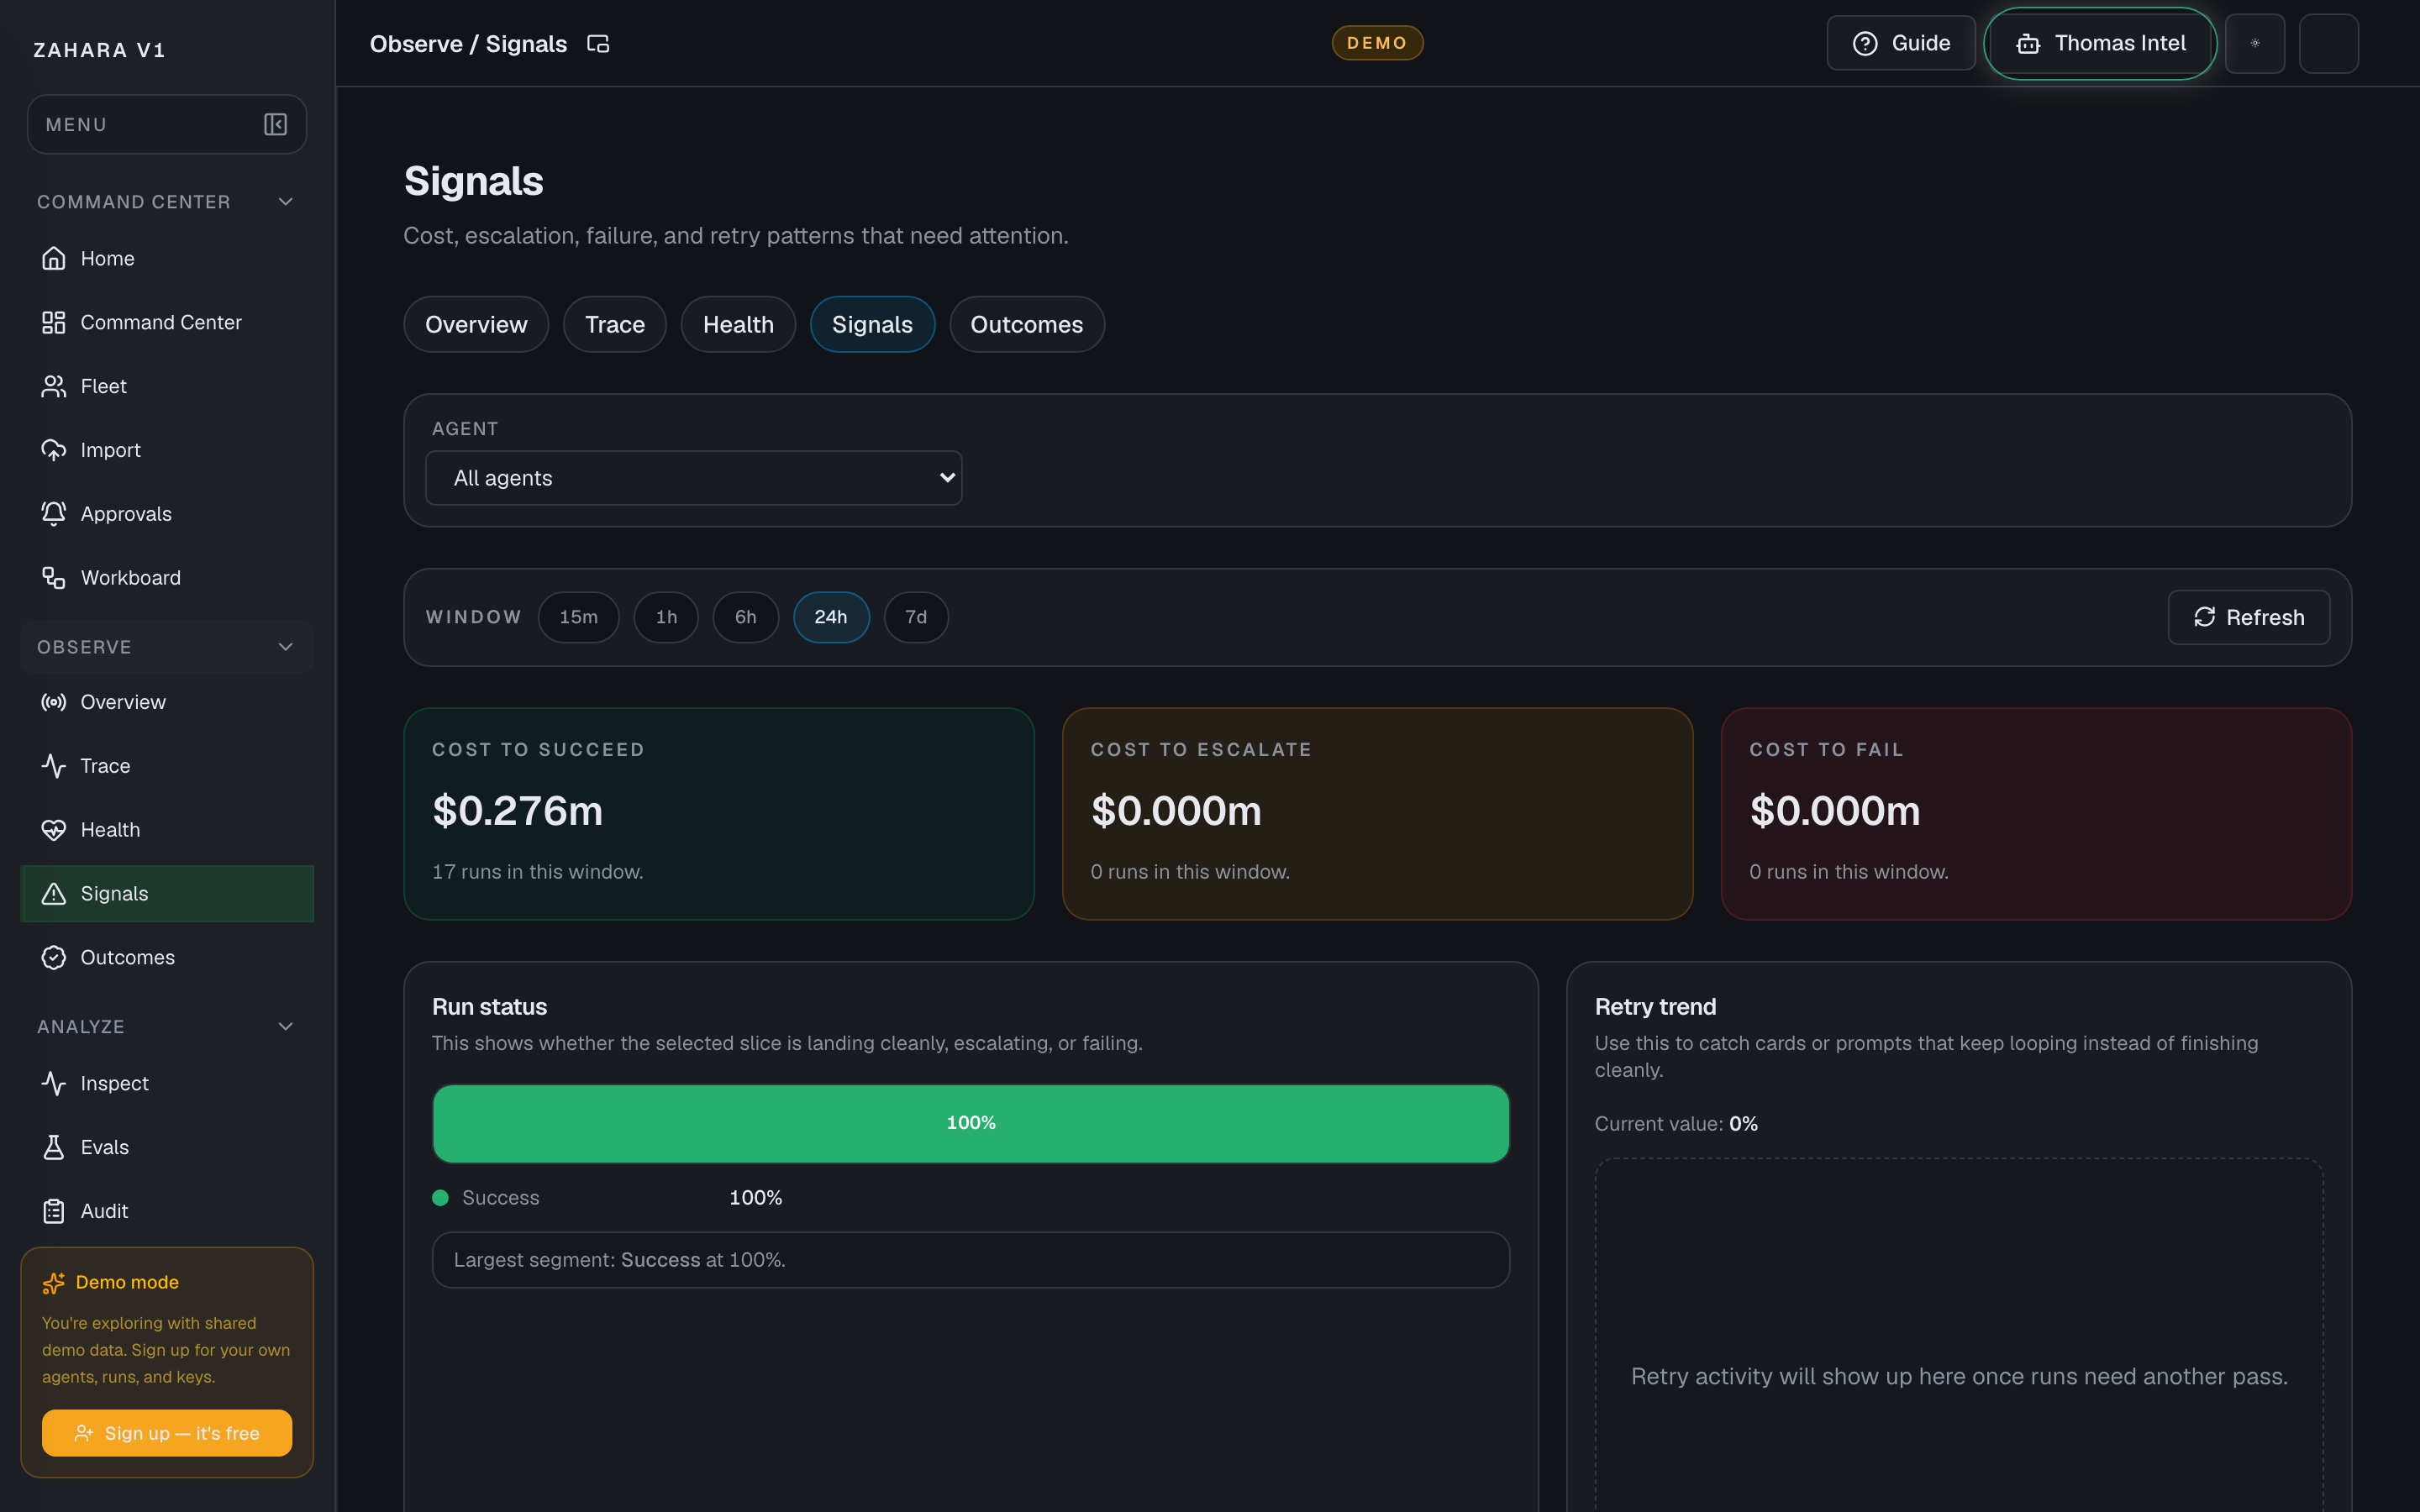
Options and features
| Option | What it does | Value it adds | How to use it |
|---|---|---|---|
| Agent filter | Switches the page between all agents and one selected agent. | Lets teams move from fleet-wide warning pressure to one agent's failure pattern without changing tools. | Use All agents first, then filter down when one agent or cost bar keeps pulling your eye. |
| Window | Changes the time slice for live signal pressure. | Helps teams tell the difference between a brief spike and a broader trend. | Use the shortest useful window first so the signal stays actionable. |
| Outcome and trend panels | Show cost to succeed, cost to escalate, cost to fail, run status mix, retry pressure, and rate trends. | Makes it easier to tell whether the real problem is quality, rework, or operator load. | Read cost per outcome first, then use the retry and rate lines to understand whether the pressure is growing. |
| Cost anomaly cards | Appear only when spend spikes or one agent carries too much daily cost. | Moves true spend spikes above the charts so they cannot be missed. | Investigate in Inspect, pause the agent if needed, or dismiss the card for the session. |
| Incident impact table | Ranks active incidents, affected tools, and impacted agents in a scannable table. | Shows whether a warning is isolated or cascading across the fleet without relying on a dense node graph. | Open the highest-impact row when anomaly cards or retry loops point to a shared dependency. |
| Error breakdown | Groups failures into tool error, model timeout, budget, schema, auth, and other categories. | Turns raw error rows into root-cause navigation. | Click a donut segment to open Inspect filtered to that category. |
| Spend calendar | Shows 30 days of spend intensity. | Makes spike days visible before opening run-level detail. | Click a dark day to inspect the runs from that date. |
| Escalation vs cost | Overlays approval rate and cost on separate axes. | Shows whether human approval is preventing expensive bad decisions or adding load. | Use the annotation and trend direction before changing approval rules. |
| Top errors table | Ranks the most common error messages and links straight to Inspect. | Turns observability into a next-action queue instead of a chart wall. | Open the highest-occurrence error first, then follow with Trace if the execution path is still unclear. |
Basic workflow
- 1Pick the time window and stay on All agents first.
- 2Read cost to succeed, escalate, and fail before opening a single run.
- 3Clear anomaly cards before reading lower-priority charts.
- 4Use status, retry, and rate trends to decide whether the problem is growing or contained.
- 5Use the incident impact table to see what else a tool or incident could break.
- 6Open failure categories, spike days, or top errors when you are ready to inspect proof.
Proof that it worked
- Signal cards load for the selected window and selected agent scope.
- Run status uses the styled stacked bar and retry trend shows the 5% threshold.
- Error breakdown, spend calendar, escalation-vs-cost, and anomaly cards render when their data is present.
- Incident impact table lists incidents, tools, affected runs, and next actions.
- Failure categories, spend days, retry callouts, and top errors link into Inspect or Trace.
Before you start
- Confirm you are on /observe/signals and looking at the right workspace.
- Read visible status, warning, or empty-state text before clicking an action.
- If the page shows IDs, copy the relevant agent, run, onboarding, or request ID before switching pages.
If you get blocked
- If the page is empty, check whether filters, scope, or time window are hiding the data.
- If an action is locked, follow the visible lock reason before trying another route.
- If Observe / Signals does not answer the question, open the linked evidence page instead of guessing.
Useful Thomas questions
- Based on the visible state, what is the next safe action?
- Which status, warning, or ID should I verify first?
- Which linked evidence page proves this Observe / Signals state?
Observe / Outcomes
What it is
Observe / Outcomes is Outcome Intelligence: the trust layer that separates a technically completed run from work the business accepted.
Value to users
It shows whether agents are producing trusted outcomes, how often humans correct or reject work, and what accepted work actually costs.
Use it when
- Understand whether completed runs are turning into accepted outcomes.
- Spot workflows with high correction or rejection rates.
- Explain why a demo or production run is trustworthy after the live action is over.
- Compare cost against accepted outcomes instead of raw request volume.
Next safe action
Start with the headline metrics, open the workflow with the widest completion-vs-acceptance gap, then use Trace, Audit, Approvals, or the Live Console to inspect the proof behind that outcome.
Related Guide pages
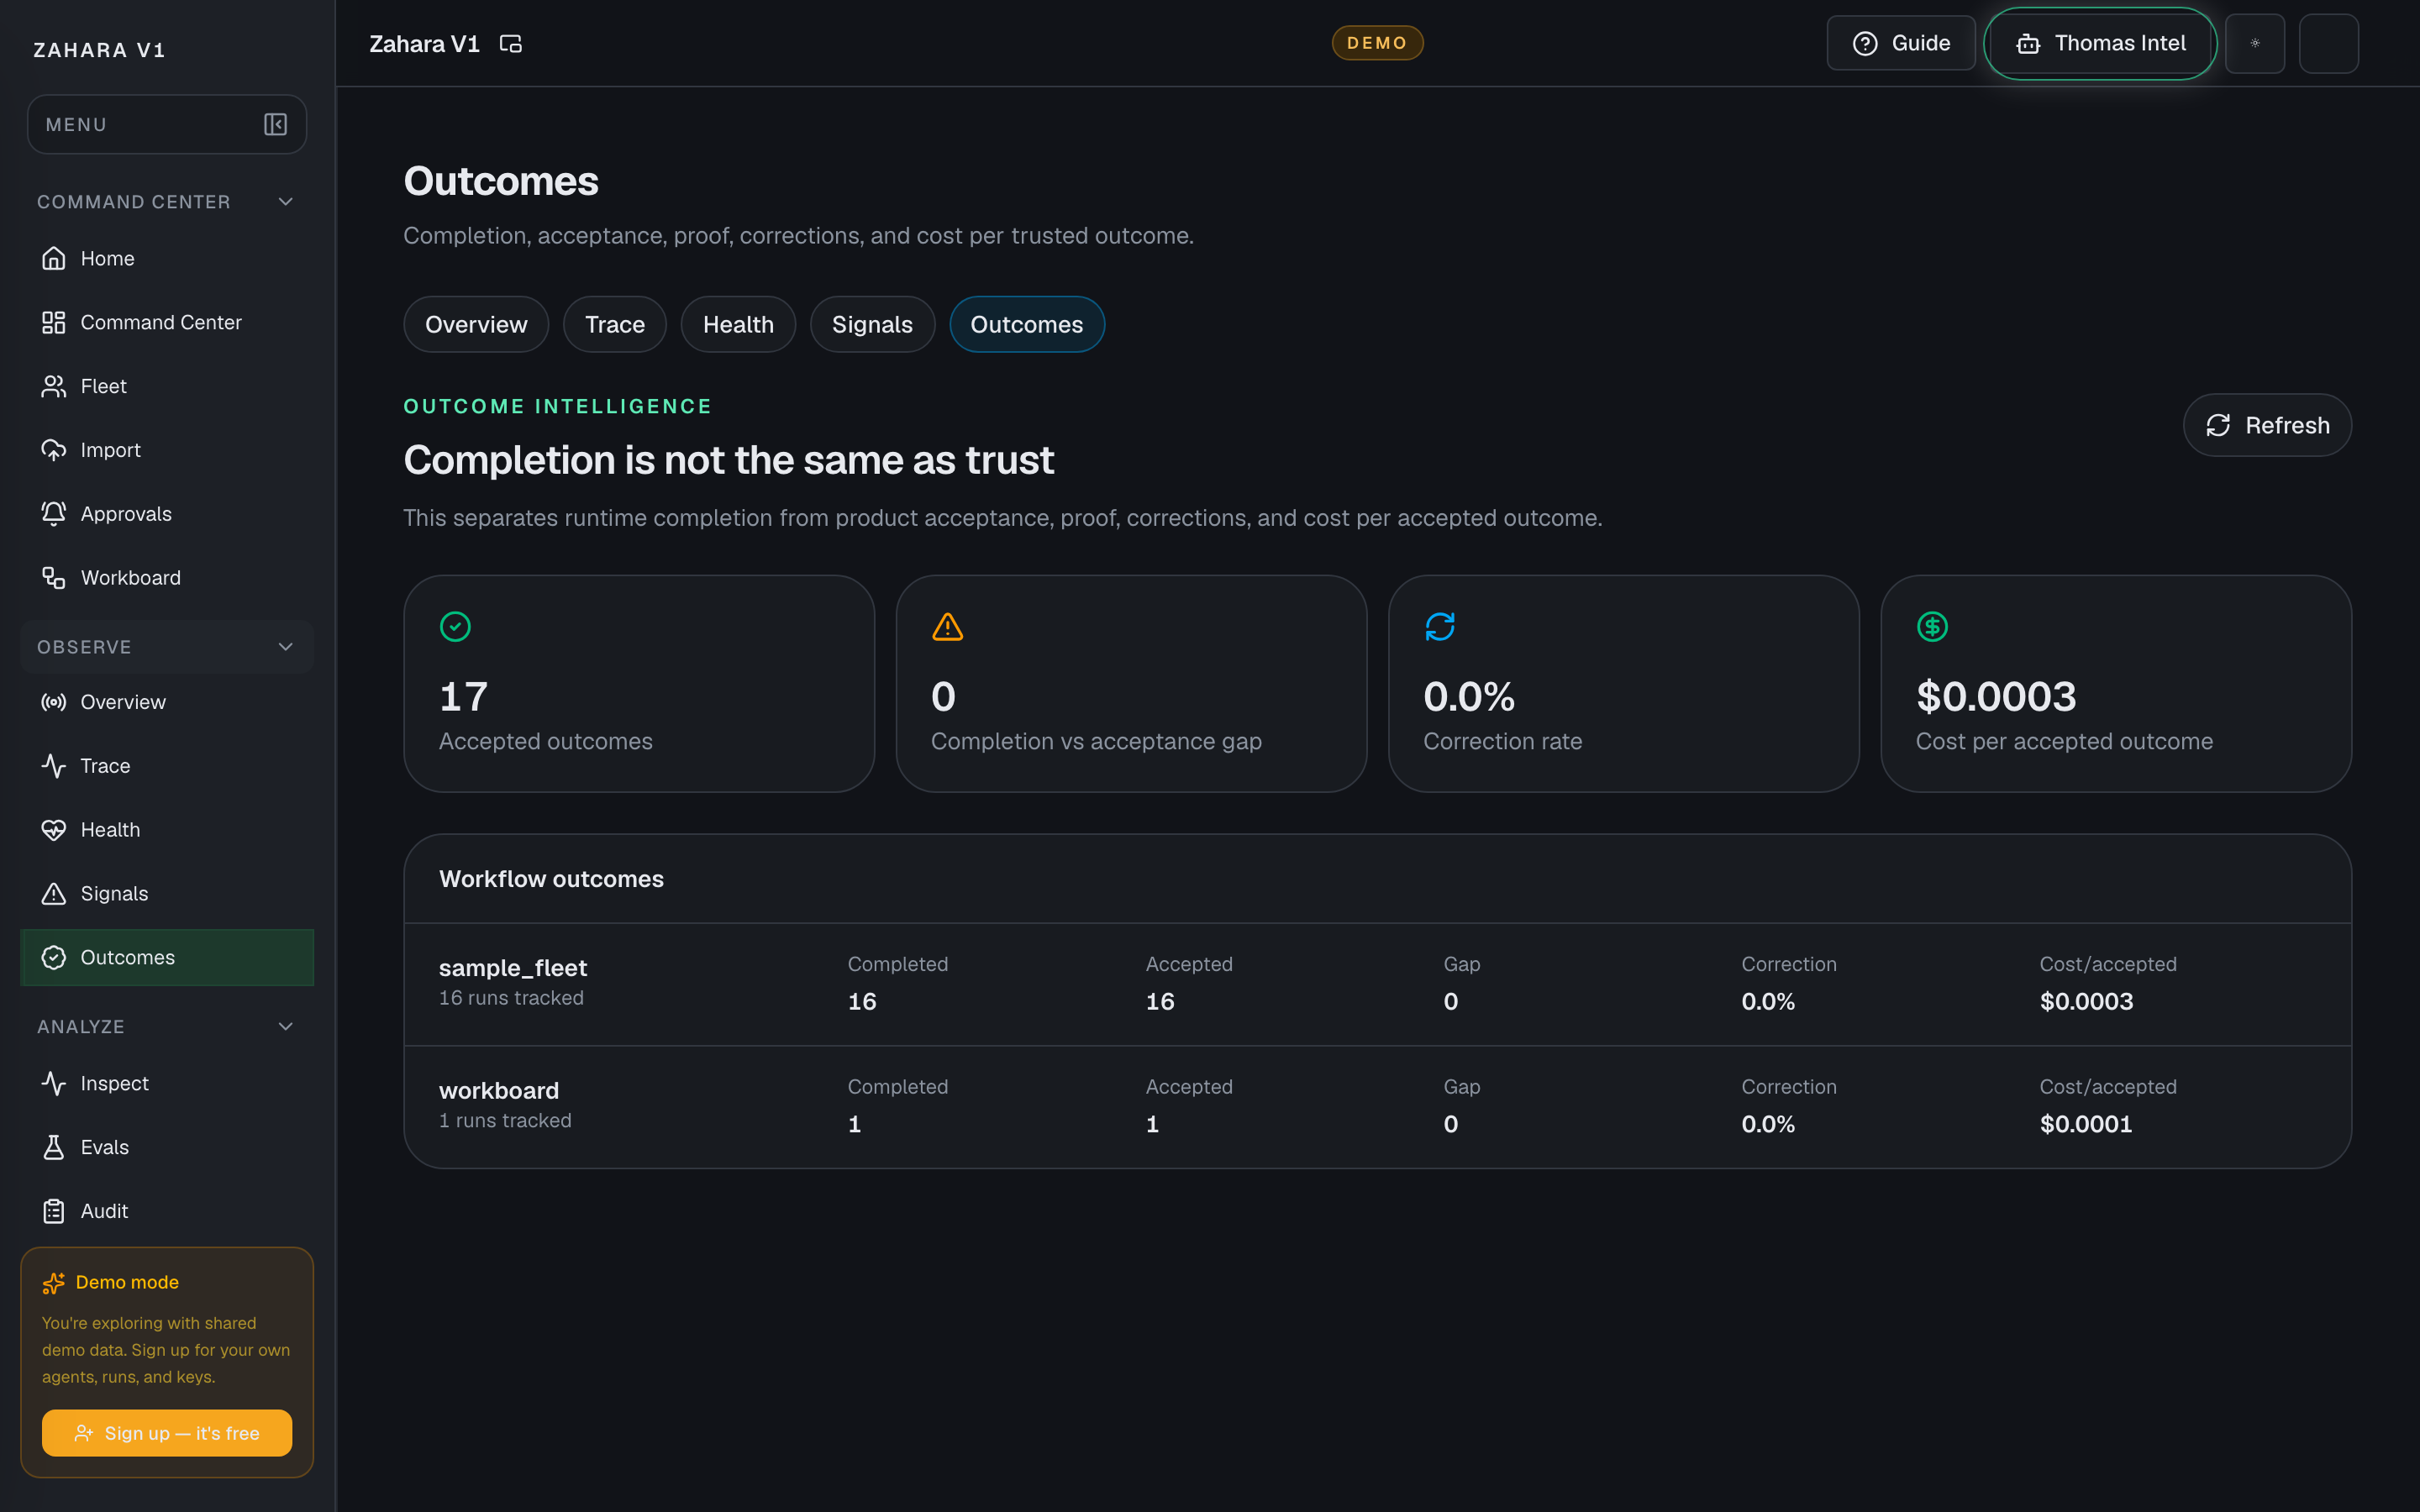
Options and features
| Option | What it does | Value it adds | How to use it |
|---|---|---|---|
| Accepted outcomes | Counts work that reached an accepted or trusted result instead of only counting terminal runs. | Prevents teams from treating every completed run as useful business value. | Use this as the first trust metric when reporting whether agents are working. |
| Completion-vs-acceptance gap | Compares technically completed runs against accepted outcomes. | Shows where agents finish but still need correction, rejection, or human follow-up. | Investigate the largest gap first, then open Trace or Audit for examples. |
| Correction rate | Shows how often a human had to correct, override, or redirect the outcome. | Turns human-review friction into a measurable product quality signal. | Use a rising correction rate to decide whether instructions, tools, approvals, or evals need work. |
| Cost per accepted outcome | Divides spend by trusted/accepted work rather than by raw requests. | Makes Gateway cost meaningful by tying spend to usable output. | Compare this with Gateway spend when an agent looks cheap per request but expensive per accepted result. |
| Workflow outcomes | Groups outcomes by workflow or status so accepted, review-needed, corrected, rejected, denied, and failed work can be compared. | Shows which work type is healthy and which one needs governance or quality attention. | Open the workflow row with the worst trust gap and follow its evidence links. |
| Evidence handoff | Connects outcome metrics back to runs, human-review decisions, Trace, Audit, and Live Console context. | Keeps Outcome Intelligence from becoming a summary with no proof behind it. | Use outcome metrics as the dashboard, then use Trace and Audit to prove the specific run. |
Basic workflow
- 1Open Observe, then Outcomes.
- 2Read the headline trust metrics before looking at individual runs.
- 3Find the workflow with the largest completion-vs-acceptance gap.
- 4Check correction rate to see whether humans are cleaning up the agent's work.
- 5Compare cost per accepted outcome against Gateway spend.
- 6Open Trace, Audit, Approvals, or Live Console when a metric needs evidence.
Proof that it worked
- The Observe tab set includes Outcomes.
- Outcome Intelligence shows the message that completion is not the same as trust.
- Accepted outcomes, completion-vs-acceptance gap, correction rate, and cost per accepted outcome are visible.
- Workflow outcomes are listed with enough context to choose the next investigation.
- Human review decisions and run outcomes can be traced back to proof pages.
Before you start
- Confirm you are on /observe/outcomes and looking at the right workspace.
- Read visible status, warning, or empty-state text before clicking an action.
- If the page shows IDs, copy the relevant agent, run, onboarding, or request ID before switching pages.
If you get blocked
- If the page is empty, check whether filters, scope, or time window are hiding the data.
- If an action is locked, follow the visible lock reason before trying another route.
- If Observe / Outcomes does not answer the question, open the linked evidence page instead of guessing.
Useful Thomas questions
- Based on the visible state, what is the next safe action?
- Which status, warning, or ID should I verify first?
- Which linked evidence page proves this Observe / Outcomes state?
Audit
What it is
Audit is the compliance-ready evidence record: tamper-evident log, diff history, actor activity, policy exceptions, config versions, policy coverage, and client-side exports.
Value to users
It proves who changed what, when policy was bypassed, what version was active, and which evidence can be exported for review.
Use it when
- Prove that something happened.
- Verify matching run IDs and request IDs.
- Review historical import, activation, run, policy exception, or config-version decisions.
Next safe action
Start with the tamper-evident status and change heatmap, then narrow by actor, config change, policy exception, date, or entity ID.
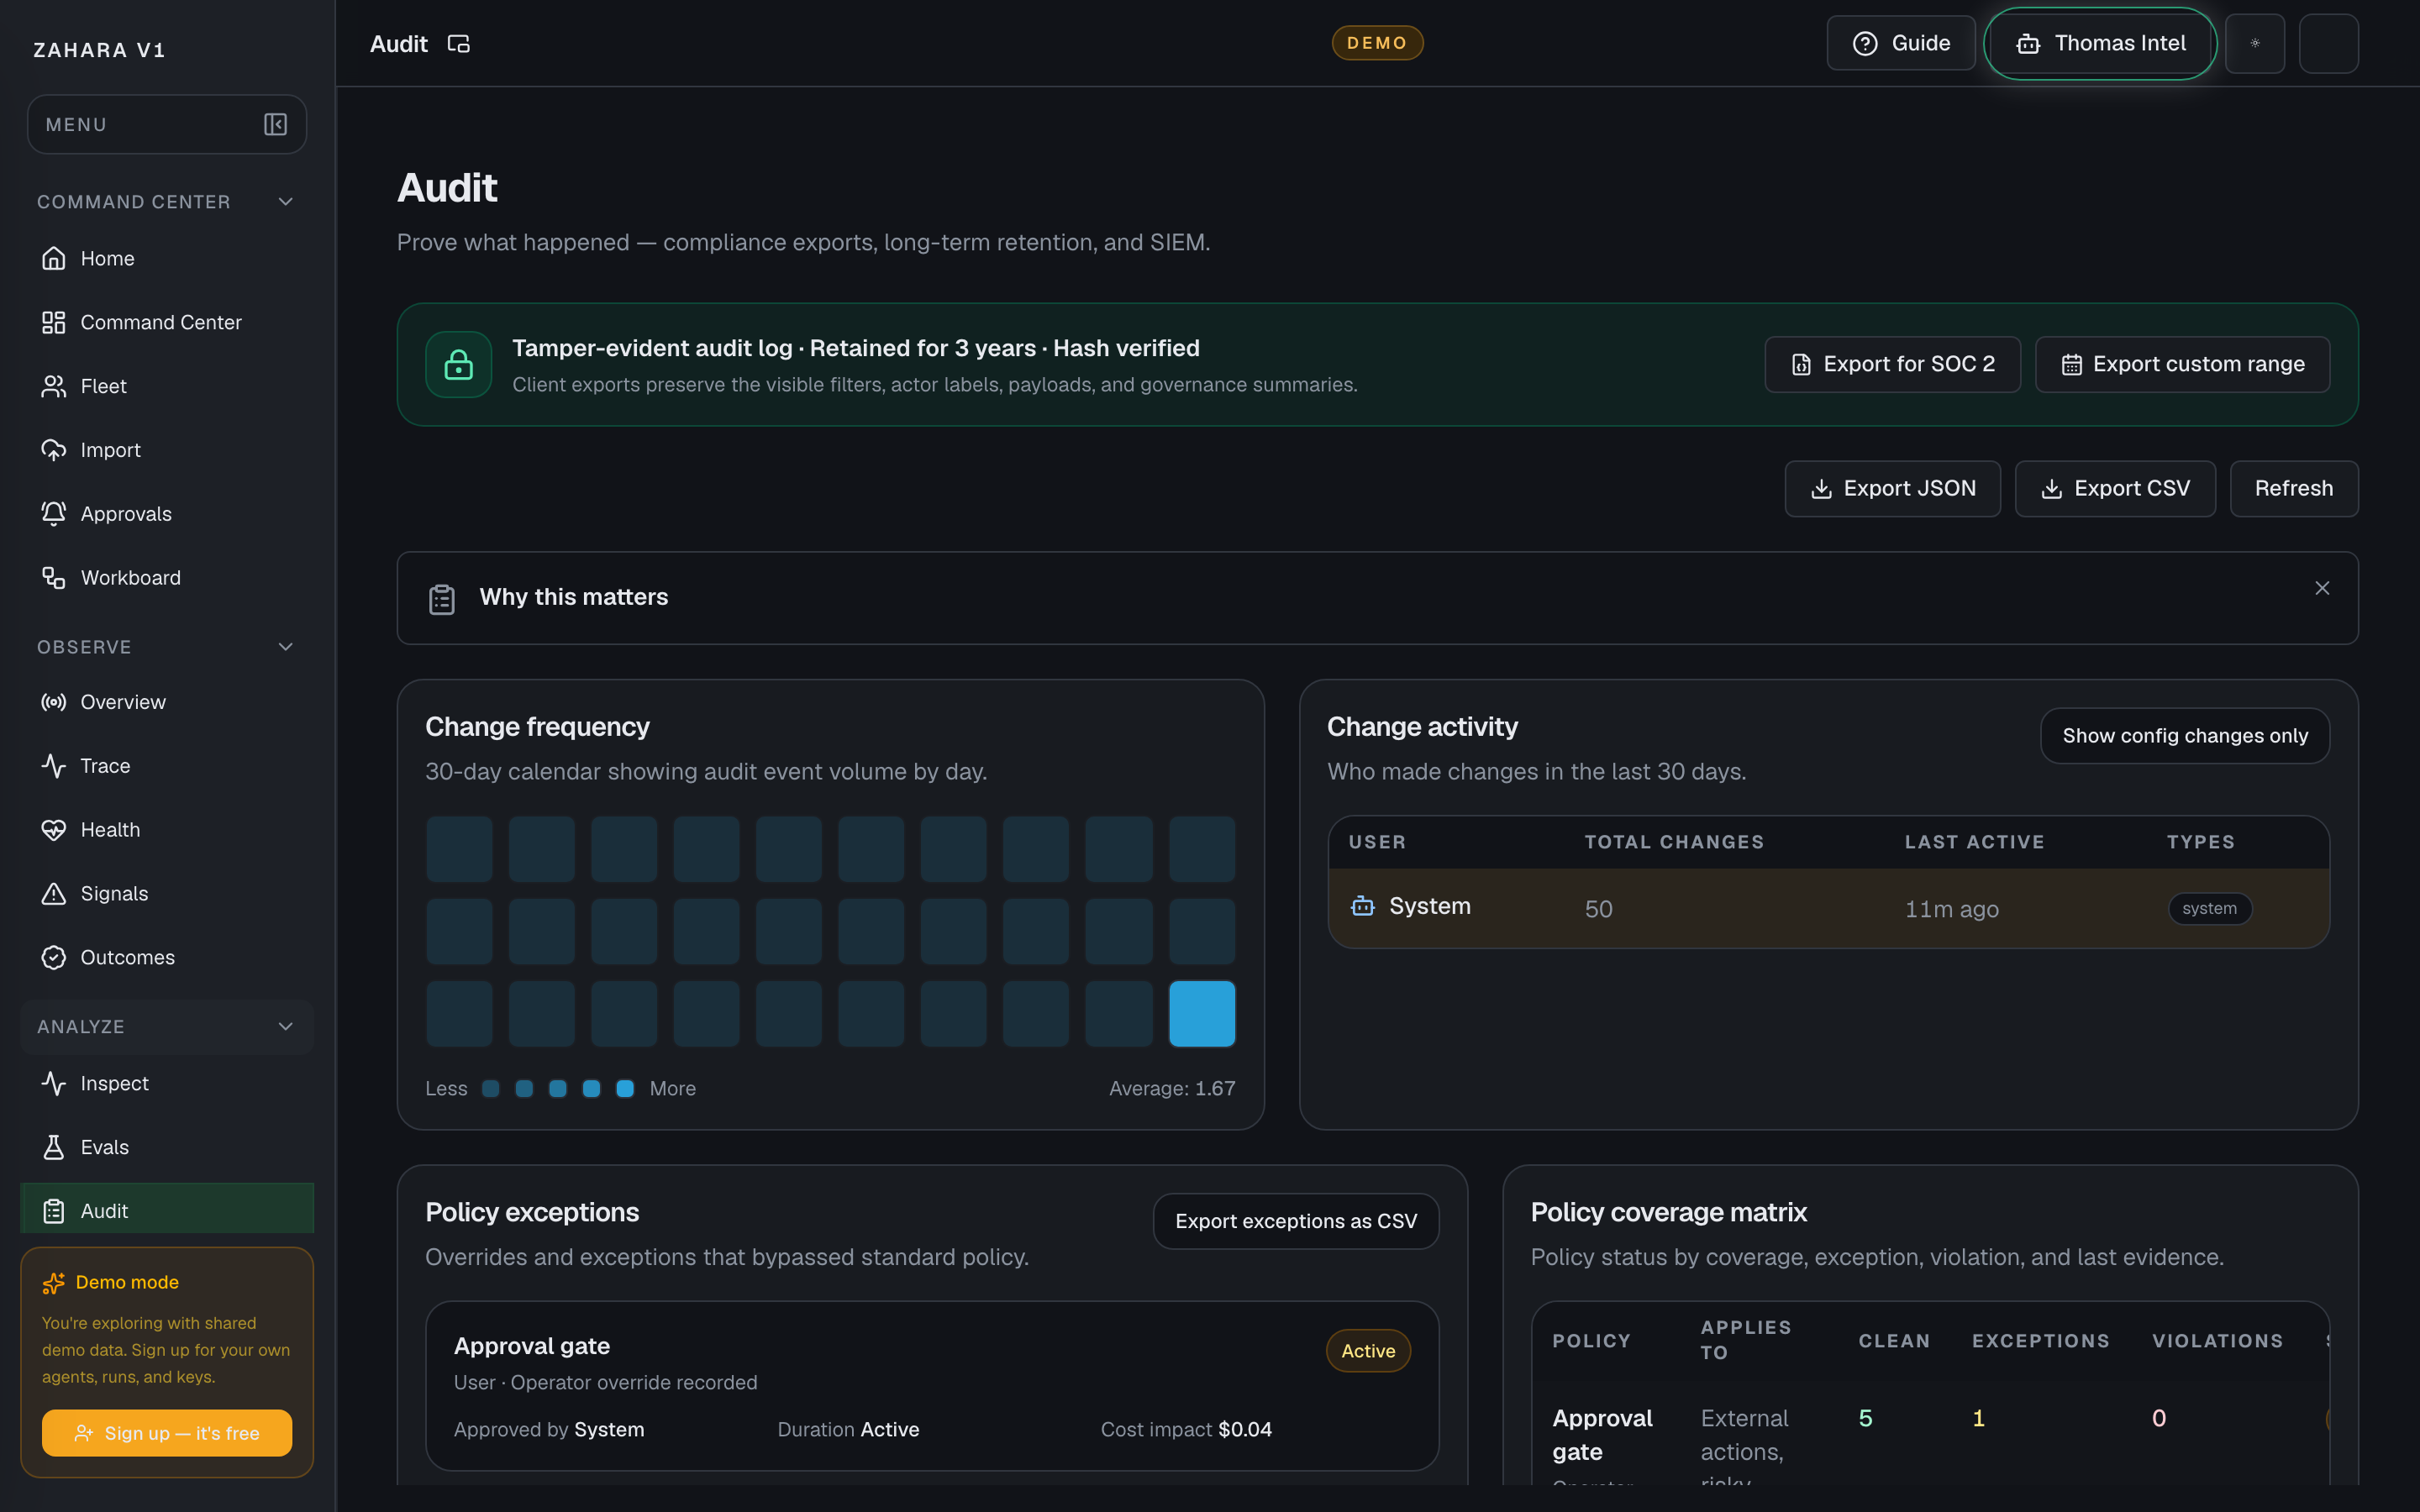
Options and features
| Option | What it does | Value it adds | How to use it |
|---|---|---|---|
| Change frequency and activity | Shows high-change days and who changed what across model, tool, budget, and prompt categories. | Helps investigators find the likely change window before reading every event. | Click a heatmap day or actor row to filter the event log. |
| Diff viewer | Expands config-change events into before/after field diffs. | Makes prompt, model, tool, budget, and policy edits reviewable. | Use Show config changes only, then expand the row that matches the incident window. |
| Policy exceptions | Lists overrides that bypassed normal policy with reason, approver, duration, cost impact, and status. | Gives compliance teams one place to review active exceptions. | Resolve active exceptions before calling a release clean. |
| Config version history | Shows per-agent version timeline with hashes, diff actions, and rollback confirmation. | Connects audit events to recoverable agent versions. | Use Diff vs current before considering rollback. |
| Policy coverage matrix | Shows policies, clean coverage, exceptions, violations, status, and last evidence in a table. | Gives compliance reviewers a fast scan of what passed, what needs review, and what still has exceptions. | Start with any exception or review row, then open the matching audit event or export the visible evidence. |
Basic workflow
- 1Confirm the tamper-evident log indicator says hash verified.
- 2Use change frequency and actor activity to find the change window.
- 3Filter Audit to config changes, policy exceptions, or the entity ID.
- 4Expand diffs or version rows before deciding on rollback.
- 5Export SOC 2 or a custom range when the evidence needs to leave Zahara.
Proof that it worked
- Tamper-evident retention and hash status are visible.
- Change heatmap, actor matrix, policy exceptions, version history, and policy coverage matrix render.
- Config-change rows can expand into before/after diffs.
- Export buttons download visible filtered audit evidence.
Before you start
- Confirm you are on /audit and looking at the right workspace.
- Read visible status, warning, or empty-state text before clicking an action.
- If the page shows IDs, copy the relevant agent, run, onboarding, or request ID before switching pages.
If you get blocked
- If the page is empty, check whether filters, scope, or time window are hiding the data.
- If an action is locked, follow the visible lock reason before trying another route.
- If Audit does not answer the question, open the linked evidence page instead of guessing.
Useful Thomas questions
- Based on the visible state, what is the next safe action?
- Which status, warning, or ID should I verify first?
- Which linked evidence page proves this Audit state?
Alert settings
What it is
Alert settings manages Zahara's governance rule engine after alerts are created from the Observe toolbar: rule templates, preview testing, firing history, rule effectiveness, review target, and delivery evidence.
Value to users
It helps teams define when Zahara should wake an operator, route an incident, or protect the fleet automatically.
Use it when
- Something looks unhealthy.
- You want to create a repeatable governance rule instead of relying on manual checks.
- The team needs to know whether alerts are useful or just noisy.
Next safe action
Create new watch rules from the Alerts button in Observe, then use Alert history and Rule effectiveness here to tune one focused rule.
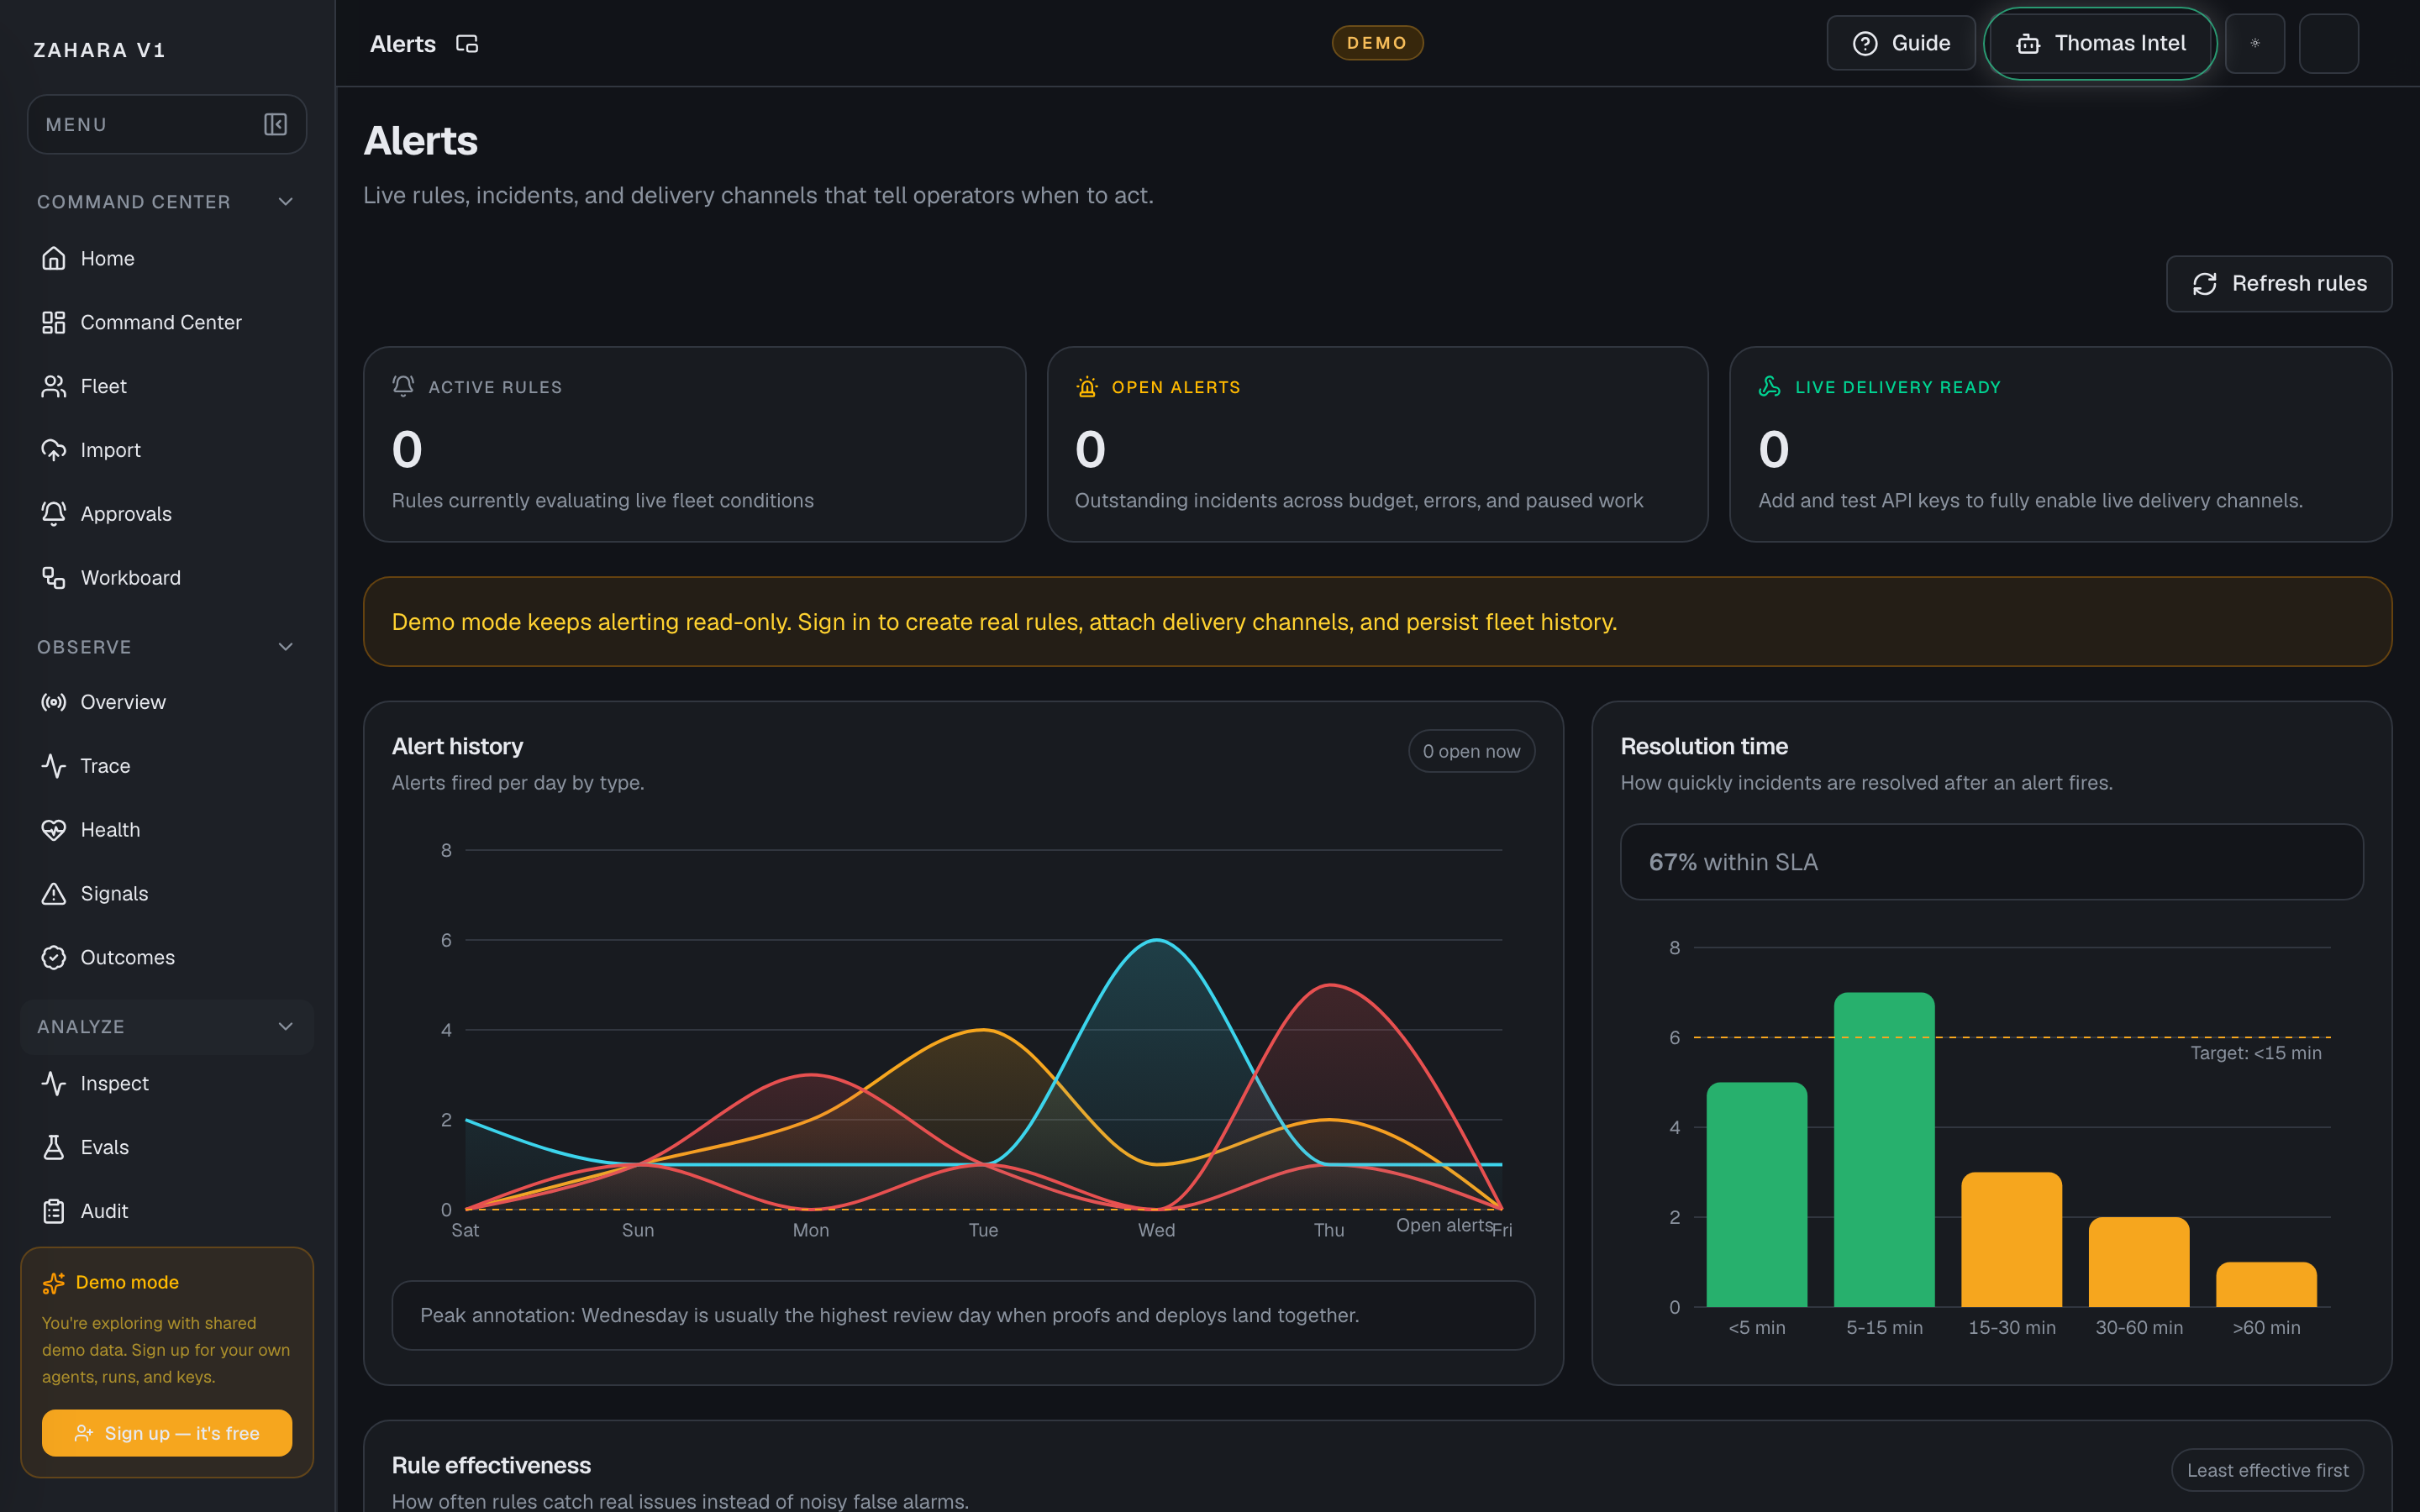
Options and features
| Option | What it does | Value it adds | How to use it |
|---|---|---|---|
| Template rule builder | Offers cost, policy, model, approval, rate limit, tool fallback, quality regression, and auto-remediation templates. | Helps new operators create useful rules without guessing the trigger model. | Pick a template, review the plain-English summary, then add delivery channels. |
| Test on last 100 runs | Shows how many times the selected rule would have fired recently. | Catches noisy rules before they become production noise. | Tune the threshold if the preview fires too often. |
| Alert history and resolution time | Shows alert firing volume by type and incident resolution buckets against the review target. | Explains whether governance rules are helping the team respond fast enough. | Investigate days or buckets that exceed normal pressure. |
| Rule effectiveness | Ranks rules by true-positive rate and flags noisy rules. | Keeps the alert system useful as the fleet grows. | Tune or disable rules below 30% effectiveness. |
| Rule docs panel | Explains when to use each rule, example scenarios, thresholds, and related docs. | Makes rules teachable for new operators. | Expand Docs on a rule row before changing or pausing it. |
Basic workflow
- 1Read Alert history and open-alert count.
- 2Check Rule effectiveness for noisy rules.
- 3Open the rule docs panel when a threshold needs context.
- 4Use the template builder and preview before saving a new rule.
- 5Confirm the fire log and delivery receipts after a rule triggers.
Proof that it worked
- Template picker, summary preview, and last-100-runs test are visible.
- Alert history, rule effectiveness, and resolution time charts render with empty states.
- Rule rows expand into documentation panels.
- Alert fire log still shows status, trigger, delivery receipts, and related entity.
Before you start
- Confirm you are on /alerts and looking at the right workspace.
- Read visible status, warning, or empty-state text before clicking an action.
- If the page shows IDs, copy the relevant agent, run, onboarding, or request ID before switching pages.
If you get blocked
- If the page is empty, check whether filters, scope, or time window are hiding the data.
- If an action is locked, follow the visible lock reason before trying another route.
- If Alert settings does not answer the question, open the linked evidence page instead of guessing.
Useful Thomas questions
- Based on the visible state, what is the next safe action?
- Which status, warning, or ID should I verify first?
- Which linked evidence page proves this Alert settings state?
Gateway
What it is
Gateway is the project-scoped model routing, key, MCP, budget, and request-evidence surface.
Value to users
It answers which LLM or SLM should handle the request, what it cost, how it routed, and whether the provider path is healthy. Fleet still governs what agents are allowed to touch.
Use it when
- Create or select a Gateway project for a customer, workspace, or sandbox.
- Check model routes, provider readiness, fallback order, and budget guardrails.
- Investigate a run failure caused by model routing.
- Inspect spend, token volume, latency, request status, and recent request evidence.
- Issue, test, or revoke Gateway keys without putting provider secrets in agent code.
Next safe action
Select the project, confirm route and key readiness, then use Requests or Inspect to prove the next safe run.
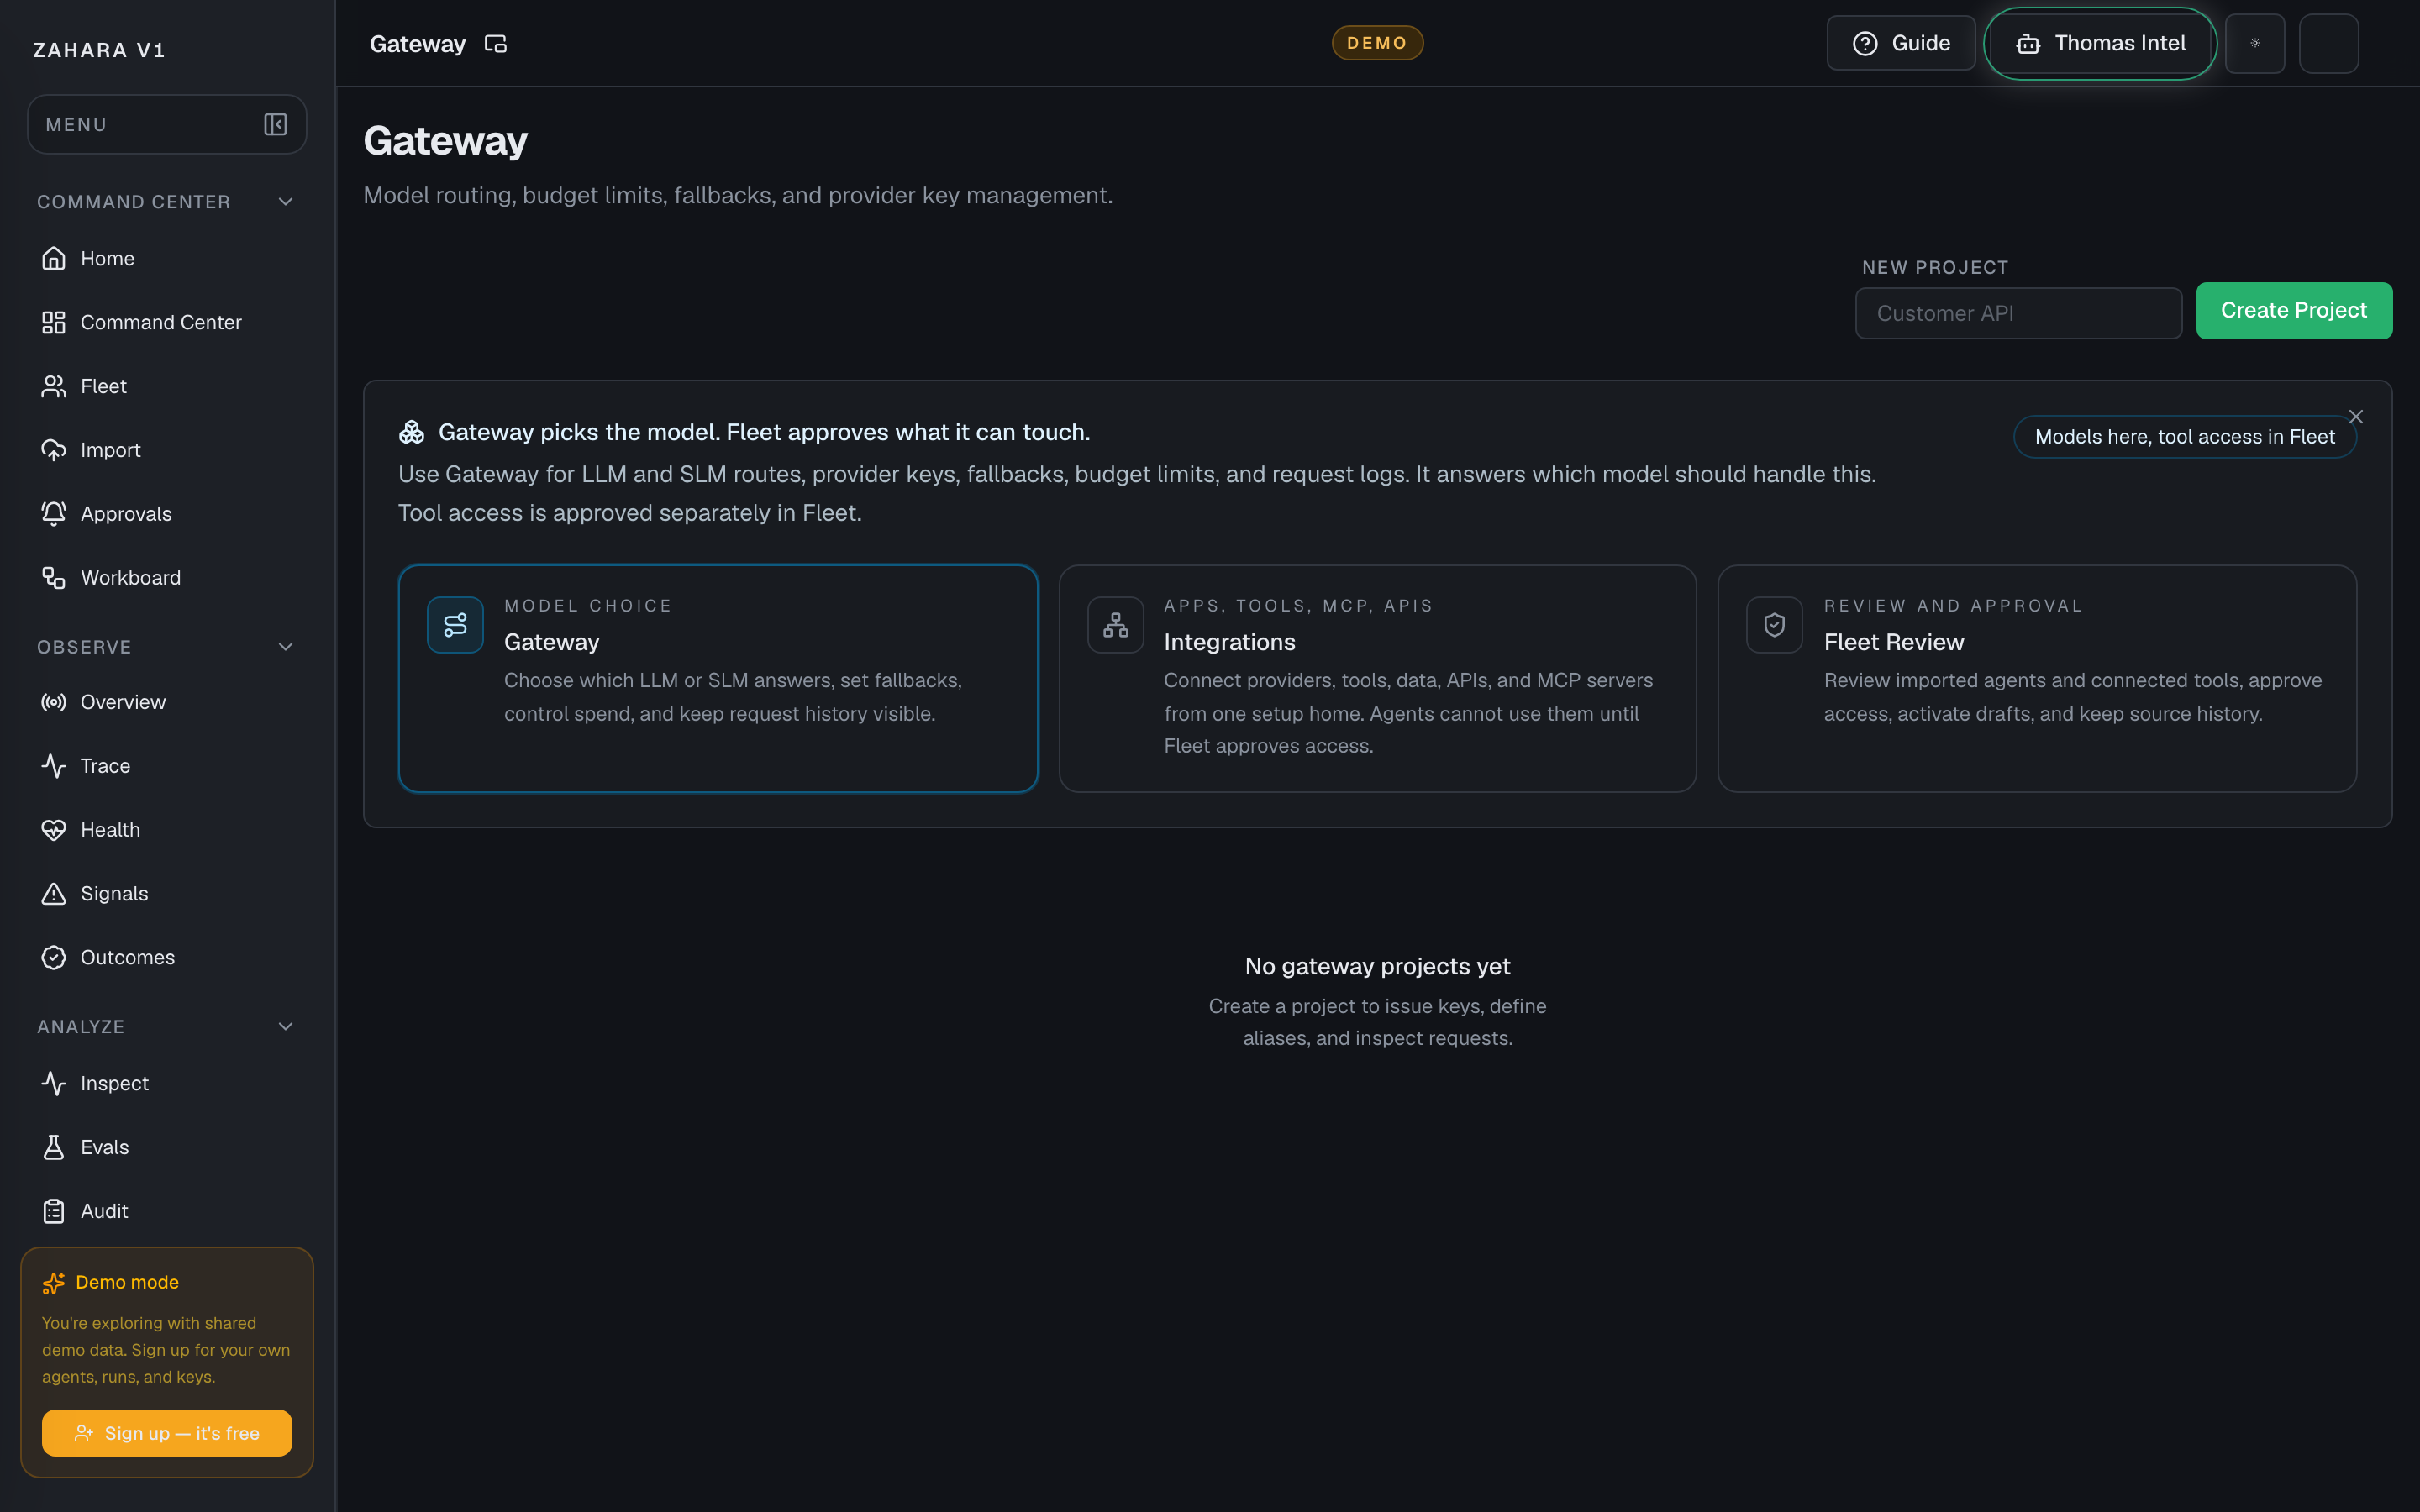
Options and features
| Option | What it does | Value it adds | How to use it |
|---|---|---|---|
| Projects | Scopes routes, keys, request logs, and summary charts to a named Gateway project. | Keeps demo, customer, and internal routing evidence separated. | Create a project with New project / Create Project, then select it from the Project dropdown. |
| Overview tab | Shows Requests, Spend, Input Tokens, Output Tokens, Avg Latency, spend over time, requests by model, provider health, and recent request preview. | Turns model routing into operational evidence instead of hidden infrastructure. | Start here when a demo or incident needs the cost, latency, or provider-health receipt. |
| Models tab | Lists aliases, primary provider/model mappings, fallback chains, provider order, default route status, and restrictions. | Explains why a run used a specific model and what fallback would happen next. | Check the alias and provider order before changing an agent prompt. |
| MCP tab | Explains the split between the model gateway and MCP/tool gateway, including MCP-in discovery and Zahara MCP-out read-only checks. | Keeps the rule clear: Gateway picks the model, Fleet approves what the agent can touch. | Use Run read-only check to verify the safe MCP endpoint before exposing tools to agents. |
| Routes tab | Creates and edits aliases with primary provider/model, fallback chain, provider order, allowed providers, timeout, daily budget, rate limit, and default-route status. | Lets the team tune routing without editing every agent. | Create named aliases like smart-default, then assign them from Configure or Flow. |
| API Keys tab | Issues Gateway keys, shows masked keys, tests keys, revokes keys, and displays last-used/request counts. | Keeps app-facing Gateway access separate from raw provider credentials. | Store newly issued keys immediately; Zahara only shows the full key once. |
| Requests tab | Filters request logs by status, model, provider, key ID, and alias, then opens request detail. | Gives operators a proof trail for routing, latency, failures, and cost. | Filter to the route alias or provider in question, then open the request detail panel. |
Basic workflow
- 1Open Gateway and choose the correct project.
- 2Use Overview to read spend, request volume, latency, provider health, and recent request previews.
- 3Open Models to confirm the alias and provider/model mapping.
- 4Open Routes to tune fallback, provider order, budget, rate limit, timeout, or default-route status.
- 5Open API Keys when an app or demo loop needs a scoped Gateway key.
- 6Open Requests to filter and inspect the exact model-call evidence.
- 7Use Fleet, Configure, or Flow for tool permission and agent assignment; do not treat Gateway as approval to touch external systems.
Proof that it worked
- The correct Gateway project is selected.
- Overview totals and charts show requests, spend, tokens, latency, provider health, and recent request previews.
- The route alias maps to the intended provider/model and fallback chain.
- The Gateway key is active, tested, and scoped to the selected project.
- The Requests tab shows the request with status, endpoint, provider, model, latency, and detail.
- Tool or MCP access remains governed by Fleet/Configure approval, not by the route alone.
Before you start
- Confirm you are on /gateway and looking at the right workspace.
- Read visible status, warning, or empty-state text before clicking an action.
- If the page shows IDs, copy the relevant agent, run, onboarding, or request ID before switching pages.
If you get blocked
- If the page is empty, check whether filters, scope, or time window are hiding the data.
- If an action is locked, follow the visible lock reason before trying another route.
- If Gateway does not answer the question, open the linked evidence page instead of guessing.
Useful Thomas questions
- Based on the visible state, what is the next safe action?
- Which status, warning, or ID should I verify first?
- Which linked evidence page proves this Gateway state?
Integrations tool registry
What it is
The tool registry now lives inside Integrations, the single setup home for providers, tools, APIs, MCP servers, data, and work systems.
Value to users
It helps users understand what external capabilities are connected or reviewable without sending them to a second setup page. Detected tools still need agent-specific approval before agents rely on them.
Use it when
- An import detected tools, MCP servers, or handoffs.
- You want to connect or inspect capabilities.
- You need to understand why a tool is blocked or needs approval.
Next safe action
Review detected tools, map them to approved Zahara capabilities, then confirm proof runs use only approved paths.
Options and features
| Option | What it does | Value it adds | How to use it |
|---|---|---|---|
| Capability list | Shows available or reviewable tools. | Makes external action surfaces visible. | Look for tools requested by imports before approving a run. |
| Approval state | Shows whether a tool is approved, blocked, or needs review. | Prevents unapproved capabilities from becoming invisible risk. | Approve only what is necessary for the agent's job. |
| Tool mapping | Connects imported tool references to Zahara-approved capabilities. | Keeps source intent without granting unsafe permissions automatically. | Map tools after reviewing purpose, scope, and proof criteria. |
Basic workflow
- 1Open the Integrations tool registry for tools detected during import.
- 2Review purpose and risk.
- 3Map to approved capability or leave blocked.
- 4Run proof and verify tool usage in Inspect or Trace.
Proof that it worked
- Tool references are visible.
- Approval or blocked state is clear.
- Proof run uses only approved tools.
Before you start
- Confirm you are on /integrations and looking at the right workspace.
- Read visible status, warning, or empty-state text before clicking an action.
- If the page shows IDs, copy the relevant agent, run, onboarding, or request ID before switching pages.
If you get blocked
- If the page is empty, check whether filters, scope, or time window are hiding the data.
- If an action is locked, follow the visible lock reason before trying another route.
- If Integrations tool registry does not answer the question, open the linked evidence page instead of guessing.
Useful Thomas questions
- Based on the visible state, what is the next safe action?
- Which status, warning, or ID should I verify first?
- Which linked evidence page proves this Integrations tool registry state?
Page Views
What it is
Page Views are saved page layouts for operational surfaces. They let users keep the team default while saving a personal arrangement of data blocks for the way they work.
Value to users
They make dashboards flexible without turning core pages into confusing blank canvases. A live workspace can save personal layouts; the demo should show the same surfaces with synthetic, read-only guardrails.
Use it when
- An operator wants Command Center, Observe, Evals, Audit, Alerts, Gateway, or Workboard arranged around their daily job.
- A team wants one calm default view while power users keep personal layouts.
- A reviewer needs to confirm a page view survives refresh before trusting it for daily work.
- A demo user needs to inspect the experience without mutating the shared synthetic workspace.
Next safe action
Start from the page itself, choose the current Page View, use Customize this page to add, remove, move, or tune data blocks, then Save for me and hard refresh to prove the layout persisted.
Related Guide pages
Options and features
| Option | What it does | Value it adds | How to use it |
|---|---|---|---|
| Page View menu | Switches between the team default and personal page views for the current surface. | Keeps page customization discoverable without adding a confusing primary-nav destination. | Open the page view menu near the page toolbar and choose the team default or one of your page views. |
| Customize this page | Enters the page edit flow for the selected layout. | Makes customization deliberate and reversible instead of changing the page by accident. | Use Customize this page, read the edit badge, then make one layout change at a time. |
| Add data block | Opens the block catalog with searchable blocks, answer labels, data sources, and default chart hints. | Lets users add useful blocks without needing to know internal metric names. | Search by the human question the block answers, add the block, and confirm the button changes to On page. |
| Remove and move blocks | Removes blocks from the current draft and moves blocks up or down in the page order. | Lets an operator simplify the page and put the most useful evidence first. | Use the block controls in edit mode, then save the layout before refreshing. |
| Block settings drawer | Opens per-block settings such as title, chart style, or block-level filters when that block supports them. | Keeps settings close to the block without putting a full settings page in the main workflow. | Select Settings on a block, make the smallest useful change, close the drawer, then Save for me. |
| Save for me | Saves the current layout as the user's personal Page View. | Persists a private layout after hard refresh without changing the team default. | Click Save for me after edits, wait for the saved confirmation, then hard refresh to verify the selected view and block order remain. |
| Team default | Keeps the shared starting layout for the workspace. | Protects new users from inheriting one power user's custom dashboard. | Use the team default as the baseline. Save personal copies unless an admin intentionally updates the shared default. |
| Demo read-only mode | Shows the same page structure and synthetic data while preventing real workspace mutation. | Lets prospects inspect the product safely without changing shared demo state. | On `app.demo.zahara.ai`, confirm synthetic/read-only messaging is visible and write actions are disabled, hidden, or clearly blocked. |
Basic workflow
- 1Open the operational page you want to shape, such as Command Center.
- 2Choose the Page View you want to start from.
- 3Click Customize this page.
- 4Add one data block from the block catalog if the page needs more evidence.
- 5Remove any block that distracts from the job.
- 6Move important blocks higher in the layout.
- 7Open block settings for any block that needs a title, chart, or filter adjustment.
- 8Click Save for me for a personal layout.
- 9Hard refresh and confirm the selected view, block order, and visible blocks persisted.
- 10In demo, repeat the visual check only and confirm the workspace remains synthetic and read-only.
Proof that it worked
- The Page View menu shows the current view and available page views.
- Customize this page enters a clear edit state.
- Add data block shows searchable blocks and On page state after adding.
- Remove block and move controls change the draft layout without page jank.
- Block settings open in a drawer instead of a blocking modal.
- Save for me persists the selected personal view and changed layout.
- A hard refresh keeps the selected personal view, block order, and visible blocks.
- Fleet remains row/list-first; Page Views do not replace Fleet's roster default.
- Demo clearly marks synthetic/read-only context and does not offer confusing write actions.
Before you start
- Confirm you are on /settings/page-views and looking at the right workspace.
- Read visible status, warning, or empty-state text before clicking an action.
- If the page shows IDs, copy the relevant agent, run, onboarding, or request ID before switching pages.
If you get blocked
- If the page is empty, check whether filters, scope, or time window are hiding the data.
- If an action is locked, follow the visible lock reason before trying another route.
- If Page Views does not answer the question, open the linked evidence page instead of guessing.
Useful Thomas questions
- Based on the visible state, what is the next safe action?
- Which status, warning, or ID should I verify first?
- Which linked evidence page proves this Page Views state?
Credentials
What it is
Credentials is the Settings vault for provider credentials, workspace secrets, and readiness signals.
Value to users
It helps users see whether the workspace can actually call the providers, tools, and secrets needed by agents and Gateway routes.
Use it when
- A model route fails.
- A provider key, tool credential, or workspace secret is missing, untested, or not ready.
- A beta tester needs to connect their own provider or tool account.
Next safe action
Open Settings, then Credentials. Add or test the required secret, confirm readiness, then run a small proof prompt before trusting bigger work.
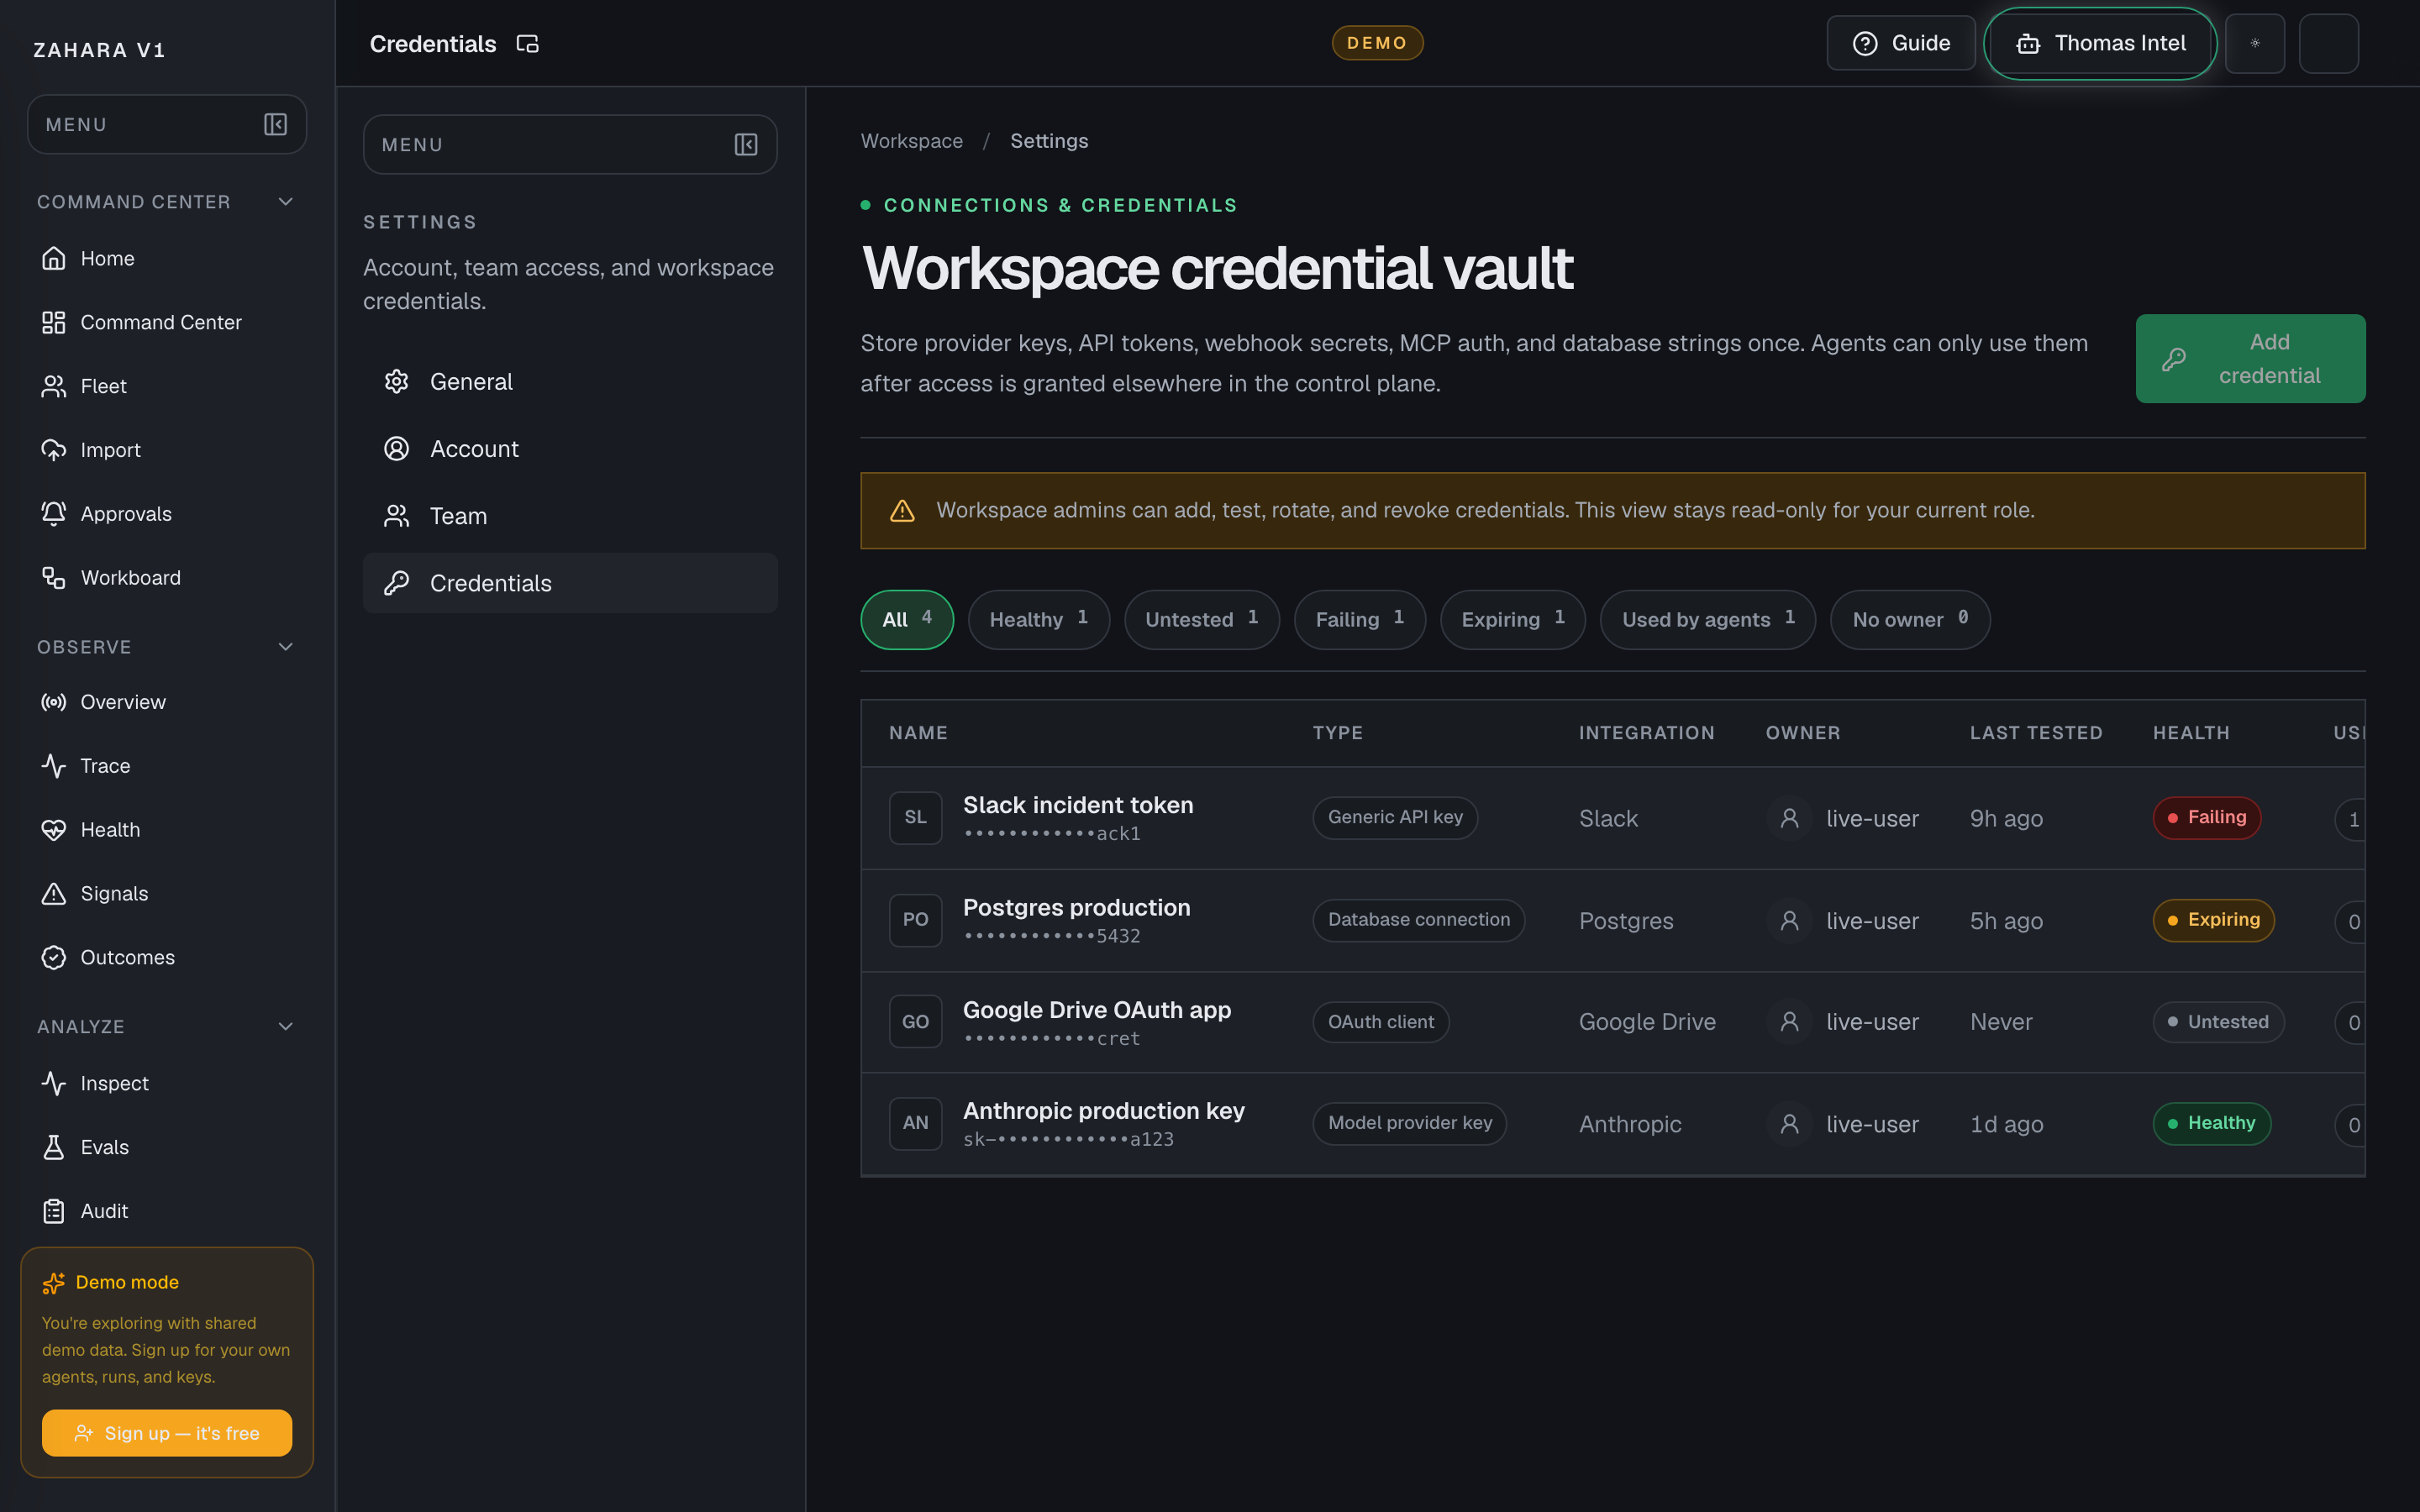
Options and features
| Option | What it does | Value it adds | How to use it |
|---|---|---|---|
| Vault readiness | Shows whether provider keys and workspace secrets exist and are usable. | Avoids confusing a credential problem with an agent problem. | Check status before running imported agents. |
| Test credential | Verifies provider connectivity. | Gives confidence before users run proof prompts. | Test after adding or changing a provider credential. |
| Gateway routing link | Connects key readiness to Gateway routes. | Shows the full path from credential to model execution. | Open Gateway after key setup to verify model route readiness. |
| Non-model secrets | Stores tool credentials such as Slack, Gmail, Linear, HubSpot, databases, MCP auth, or OpenAPI tokens. | Keeps model intelligence and tool access explicit instead of hiding them inside prompts or agent code. | Add tool credentials here, then approve actual agent use from Fleet or Configure. |
Basic workflow
- 1Open Settings, then Credentials.
- 2Add or confirm the provider key or workspace secret.
- 3Test the credential when a test action is available.
- 4Open Gateway to confirm route readiness.
- 5Run one proof prompt from Agent Cockpit or Studio.
- 6For tools and MCP, confirm the credential exists here and the agent-specific permission exists in Fleet or Configure.
Proof that it worked
- The Credentials page uses the vault framing.
- Provider or secret readiness is visible.
- Gateway route can use the provider.
- Proof run does not fail on missing credentials.
- Tool credentials are not treated as agent approval by themselves.
Before you start
- Confirm you are on /settings/credentials and looking at the right workspace.
- Read visible status, warning, or empty-state text before clicking an action.
- If the page shows IDs, copy the relevant agent, run, onboarding, or request ID before switching pages.
If you get blocked
- If the page is empty, check whether filters, scope, or time window are hiding the data.
- If an action is locked, follow the visible lock reason before trying another route.
- If Credentials does not answer the question, open the linked evidence page instead of guessing.
Useful Thomas questions
- Based on the visible state, what is the next safe action?
- Which status, warning, or ID should I verify first?
- Which linked evidence page proves this Credentials state?
Team
What it is
Team is the Settings surface for workspace people, invitations, workspace switching, and the viewer / operator / admin role model.
Value to users
It controls who can view, operate, or administer the workspace without forcing teams to share accounts.
Use it when
- Add beta testers or operators.
- A user needs role access.
- A workspace needs a cleaner handoff from admin to team users.
- A demo or customer workspace needs least-privilege access before anyone touches live operations.
Next safe action
Open Settings, then Team. Invite only the people who need access, give the least powerful role that fits, and confirm they can reach the pages they need without exposing admin-only controls.
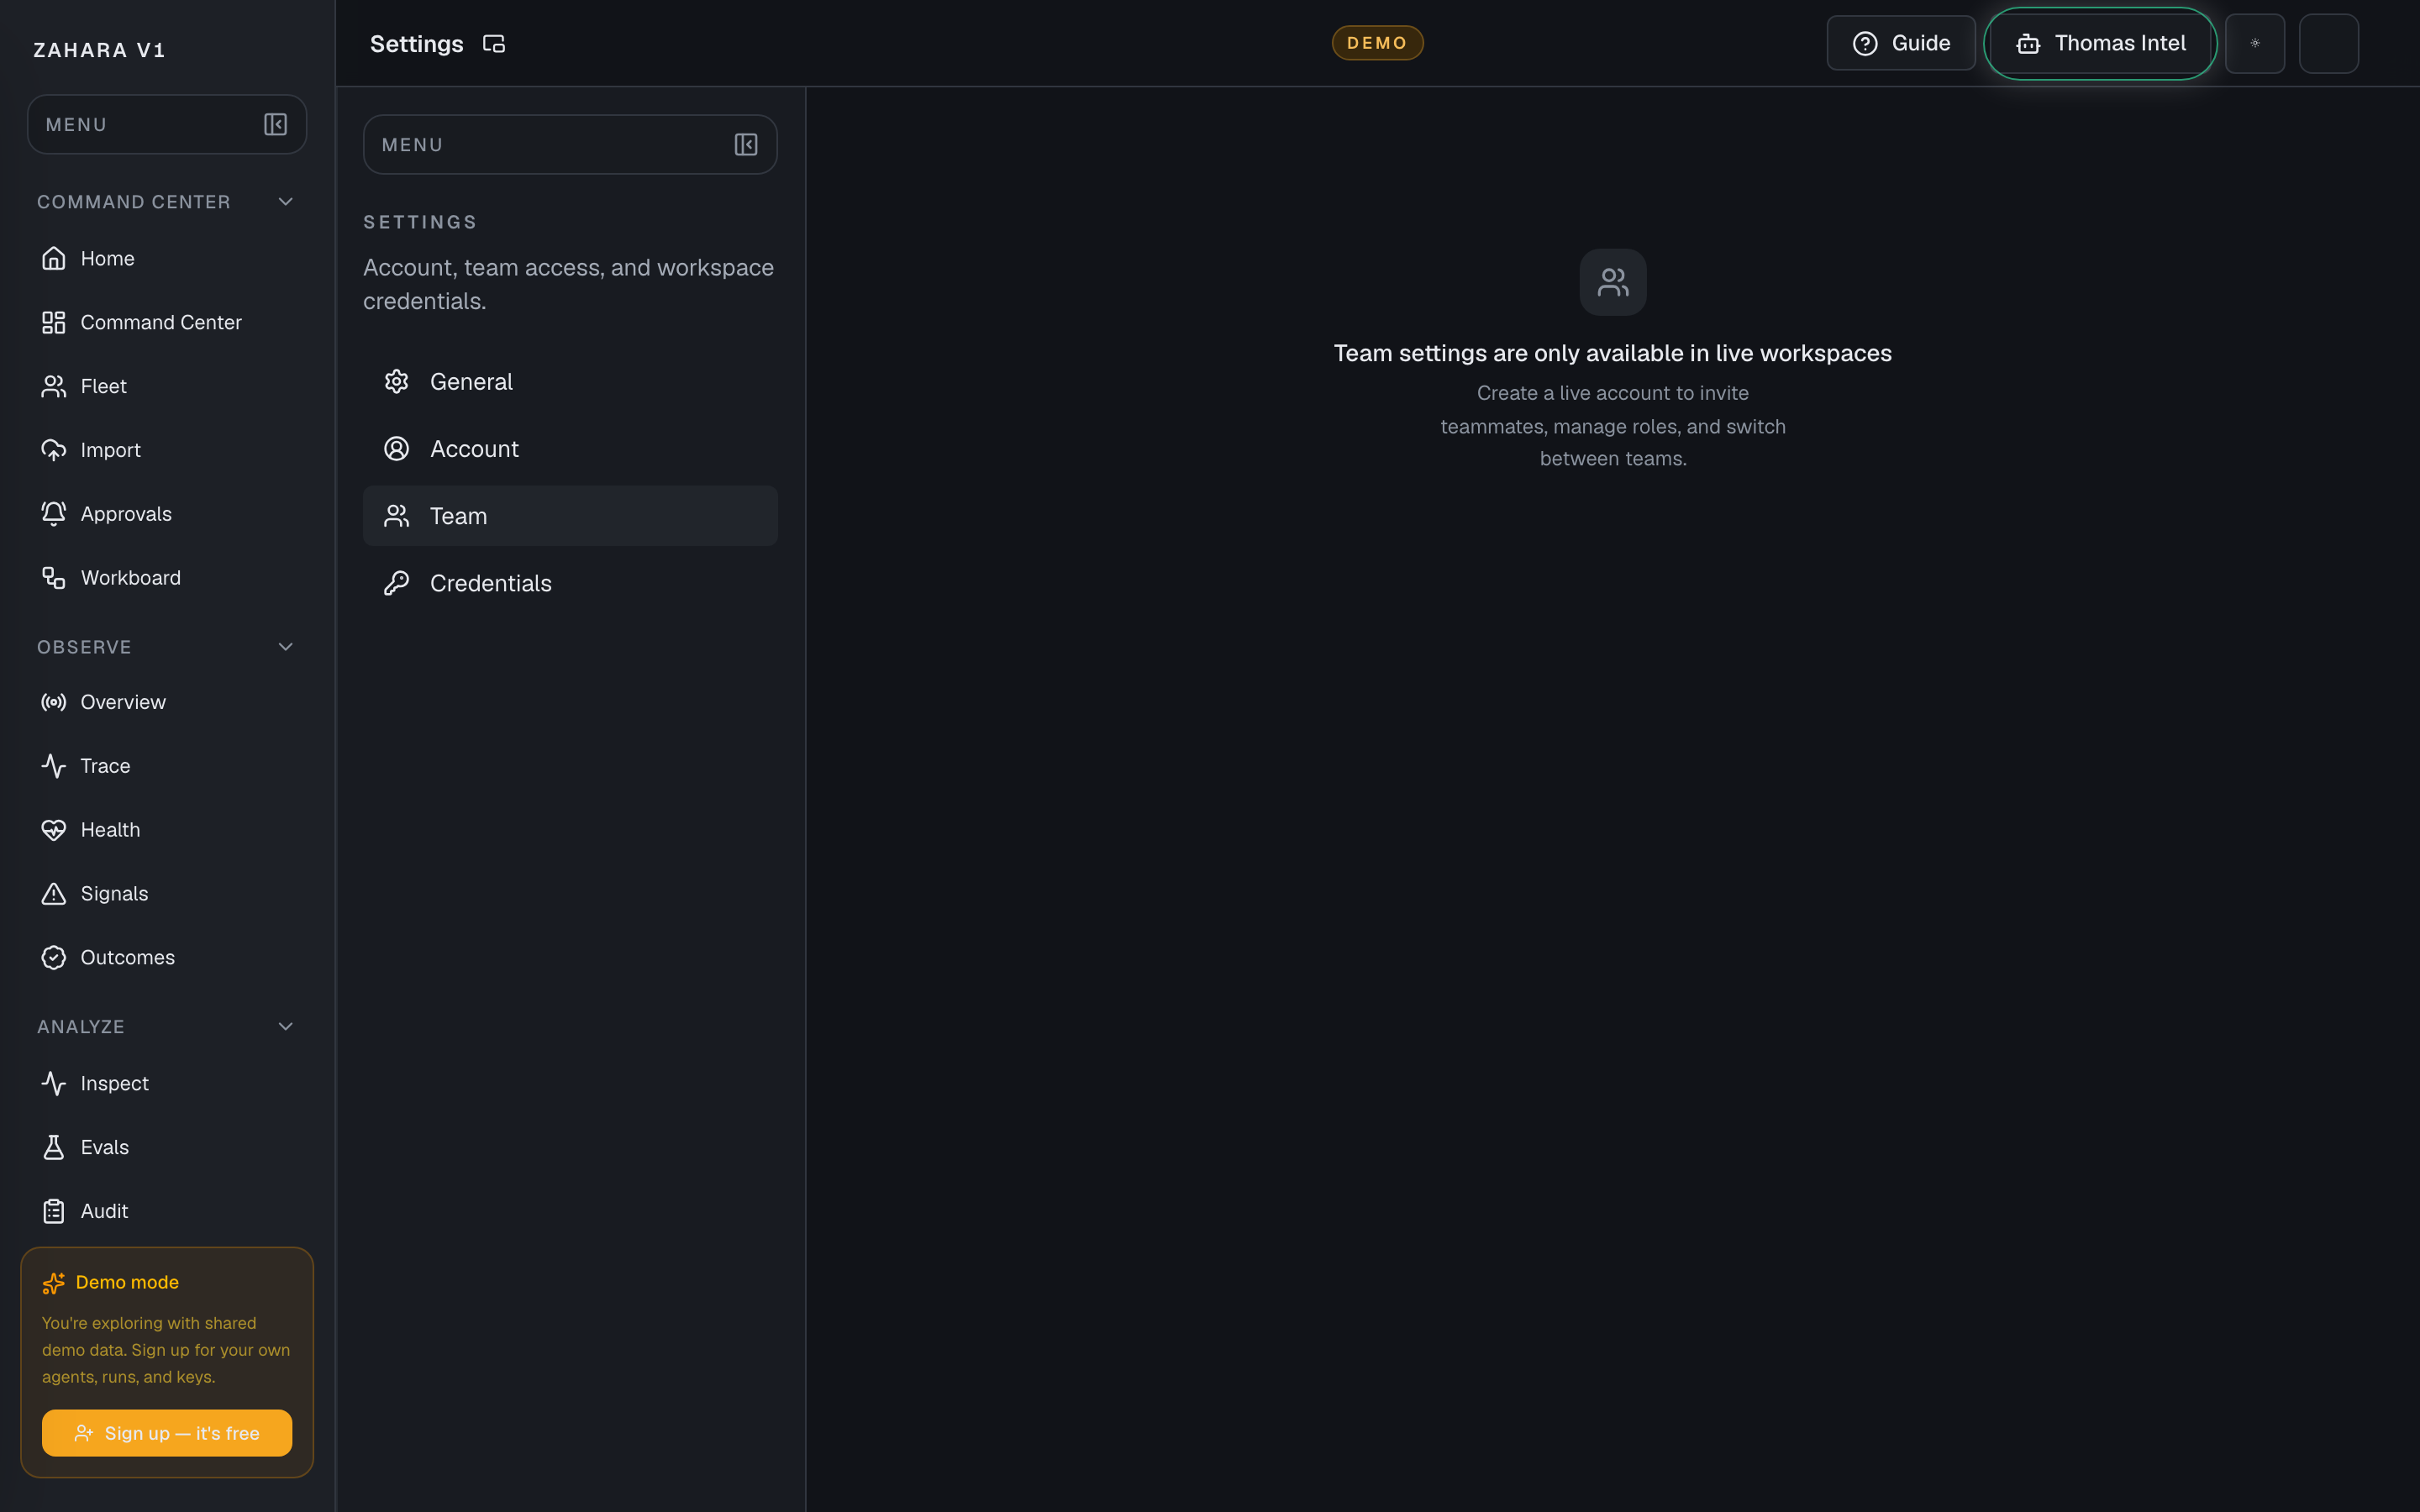
Options and features
| Option | What it does | Value it adds | How to use it |
|---|---|---|---|
| Workspace summary | Shows the active workspace, available teams, active members, and your current role. | Keeps users from changing the wrong workspace or assuming they have admin rights when they do not. | Check this first before inviting, switching workspaces, or changing roles. |
| Viewer role | Allows read-only access to workspace pages and evidence without day-to-day mutation rights. | Best for reviewers, observers, and demo viewers who need visibility but should not run, edit, approve, or administer the workspace. | Start here when a person only needs to inspect Command Center, Fleet, Observe, Trace, Audit, Gateway, docs, or other read-only evidence. |
| Operator role | Adds day-to-day operating rights such as creating/updating agents, running/retrying/canceling/replaying runs, managing workboard/fleet runtime operations, configuring capability bindings, and approving operational changes where the API allows operator access. | Best for trusted operators who need to move work but should not own credentials, team access, service tokens, or destructive admin cleanup. | Use operator for daily agent operations, then check Audit after high-impact actions. |
| Admin role | Adds sensitive administration rights such as inviting/removing members, changing roles, managing provider keys and workspace credentials, creating/revoking workspace service tokens, deleting agents/runs, and other owner-level controls. | Keeps secrets, team access, and destructive actions limited to trusted workspace owners. | Use admin sparingly. Prefer one owner and one trusted backup rather than making every operator an admin. |
| Invite teammate | Sends a role-scoped invitation by email. | Lets real testers or teammates join with their own account instead of sharing credentials. | Admins enter the email, choose viewer/operator/admin, send the invitation, then track pending invitations. |
| Pending and incoming invitations | Shows invitations sent from the active team and invitations waiting for the current user. | Makes handoff state visible before a demo, beta review, or customer workspace setup. | Resend or revoke pending invitations as an admin; accept incoming invitations when joining a workspace. |
| Workspace switcher | Creates or switches isolated workspaces/teams for testing and operations. | Prevents data and access from mixing across customer, internal, demo, or test workspaces. | Confirm the active workspace before running agents, changing roles, or updating credentials. |
Basic workflow
- 1Open Settings -> Team.
- 2Confirm the active workspace is correct.
- 3Choose the least-powerful role that fits the job: viewer, operator, or admin.
- 4Invite the teammate with that role.
- 5Have them accept the invitation and sign in.
- 6Verify they can reach the needed pages and cannot see controls outside their role.
- 7Use Audit or visible team state to confirm sensitive role/access changes.
Proof that it worked
- Member appears in Team.
- Role is one of viewer, operator, or admin and matches intended access.
- Pending invitations show email, role, and expiry until accepted or revoked.
- User can access beta pages without guest mode.
- Viewer users do not get admin-only credential, role, service-token, or delete controls.
- Operator users can perform approved day-to-day operations without owning secrets or team access.
- Admin-only changes are limited to admin users.
Before you start
- Confirm you are on /settings/team and looking at the right workspace.
- Read visible status, warning, or empty-state text before clicking an action.
- If the page shows IDs, copy the relevant agent, run, onboarding, or request ID before switching pages.
If you get blocked
- If the page is empty, check whether filters, scope, or time window are hiding the data.
- If an action is locked, follow the visible lock reason before trying another route.
- If Team does not answer the question, open the linked evidence page instead of guessing.
Useful Thomas questions
- Based on the visible state, what is the next safe action?
- Which status, warning, or ID should I verify first?
- Which linked evidence page proves this Team state?
Feedback
What it is
Feedback is the in-product place to report bugs, confusing moments, suggestions, or praise.
Value to users
It gives beta users a direct way to tell the team what blocked them while the context is still fresh.
Use it when
- A user hits friction.
- A beta tester cannot tell what to do next.
- A page is confusing or missing needed evidence.
Next safe action
Submit a clear title, what happened, what was expected, and the page where it happened.
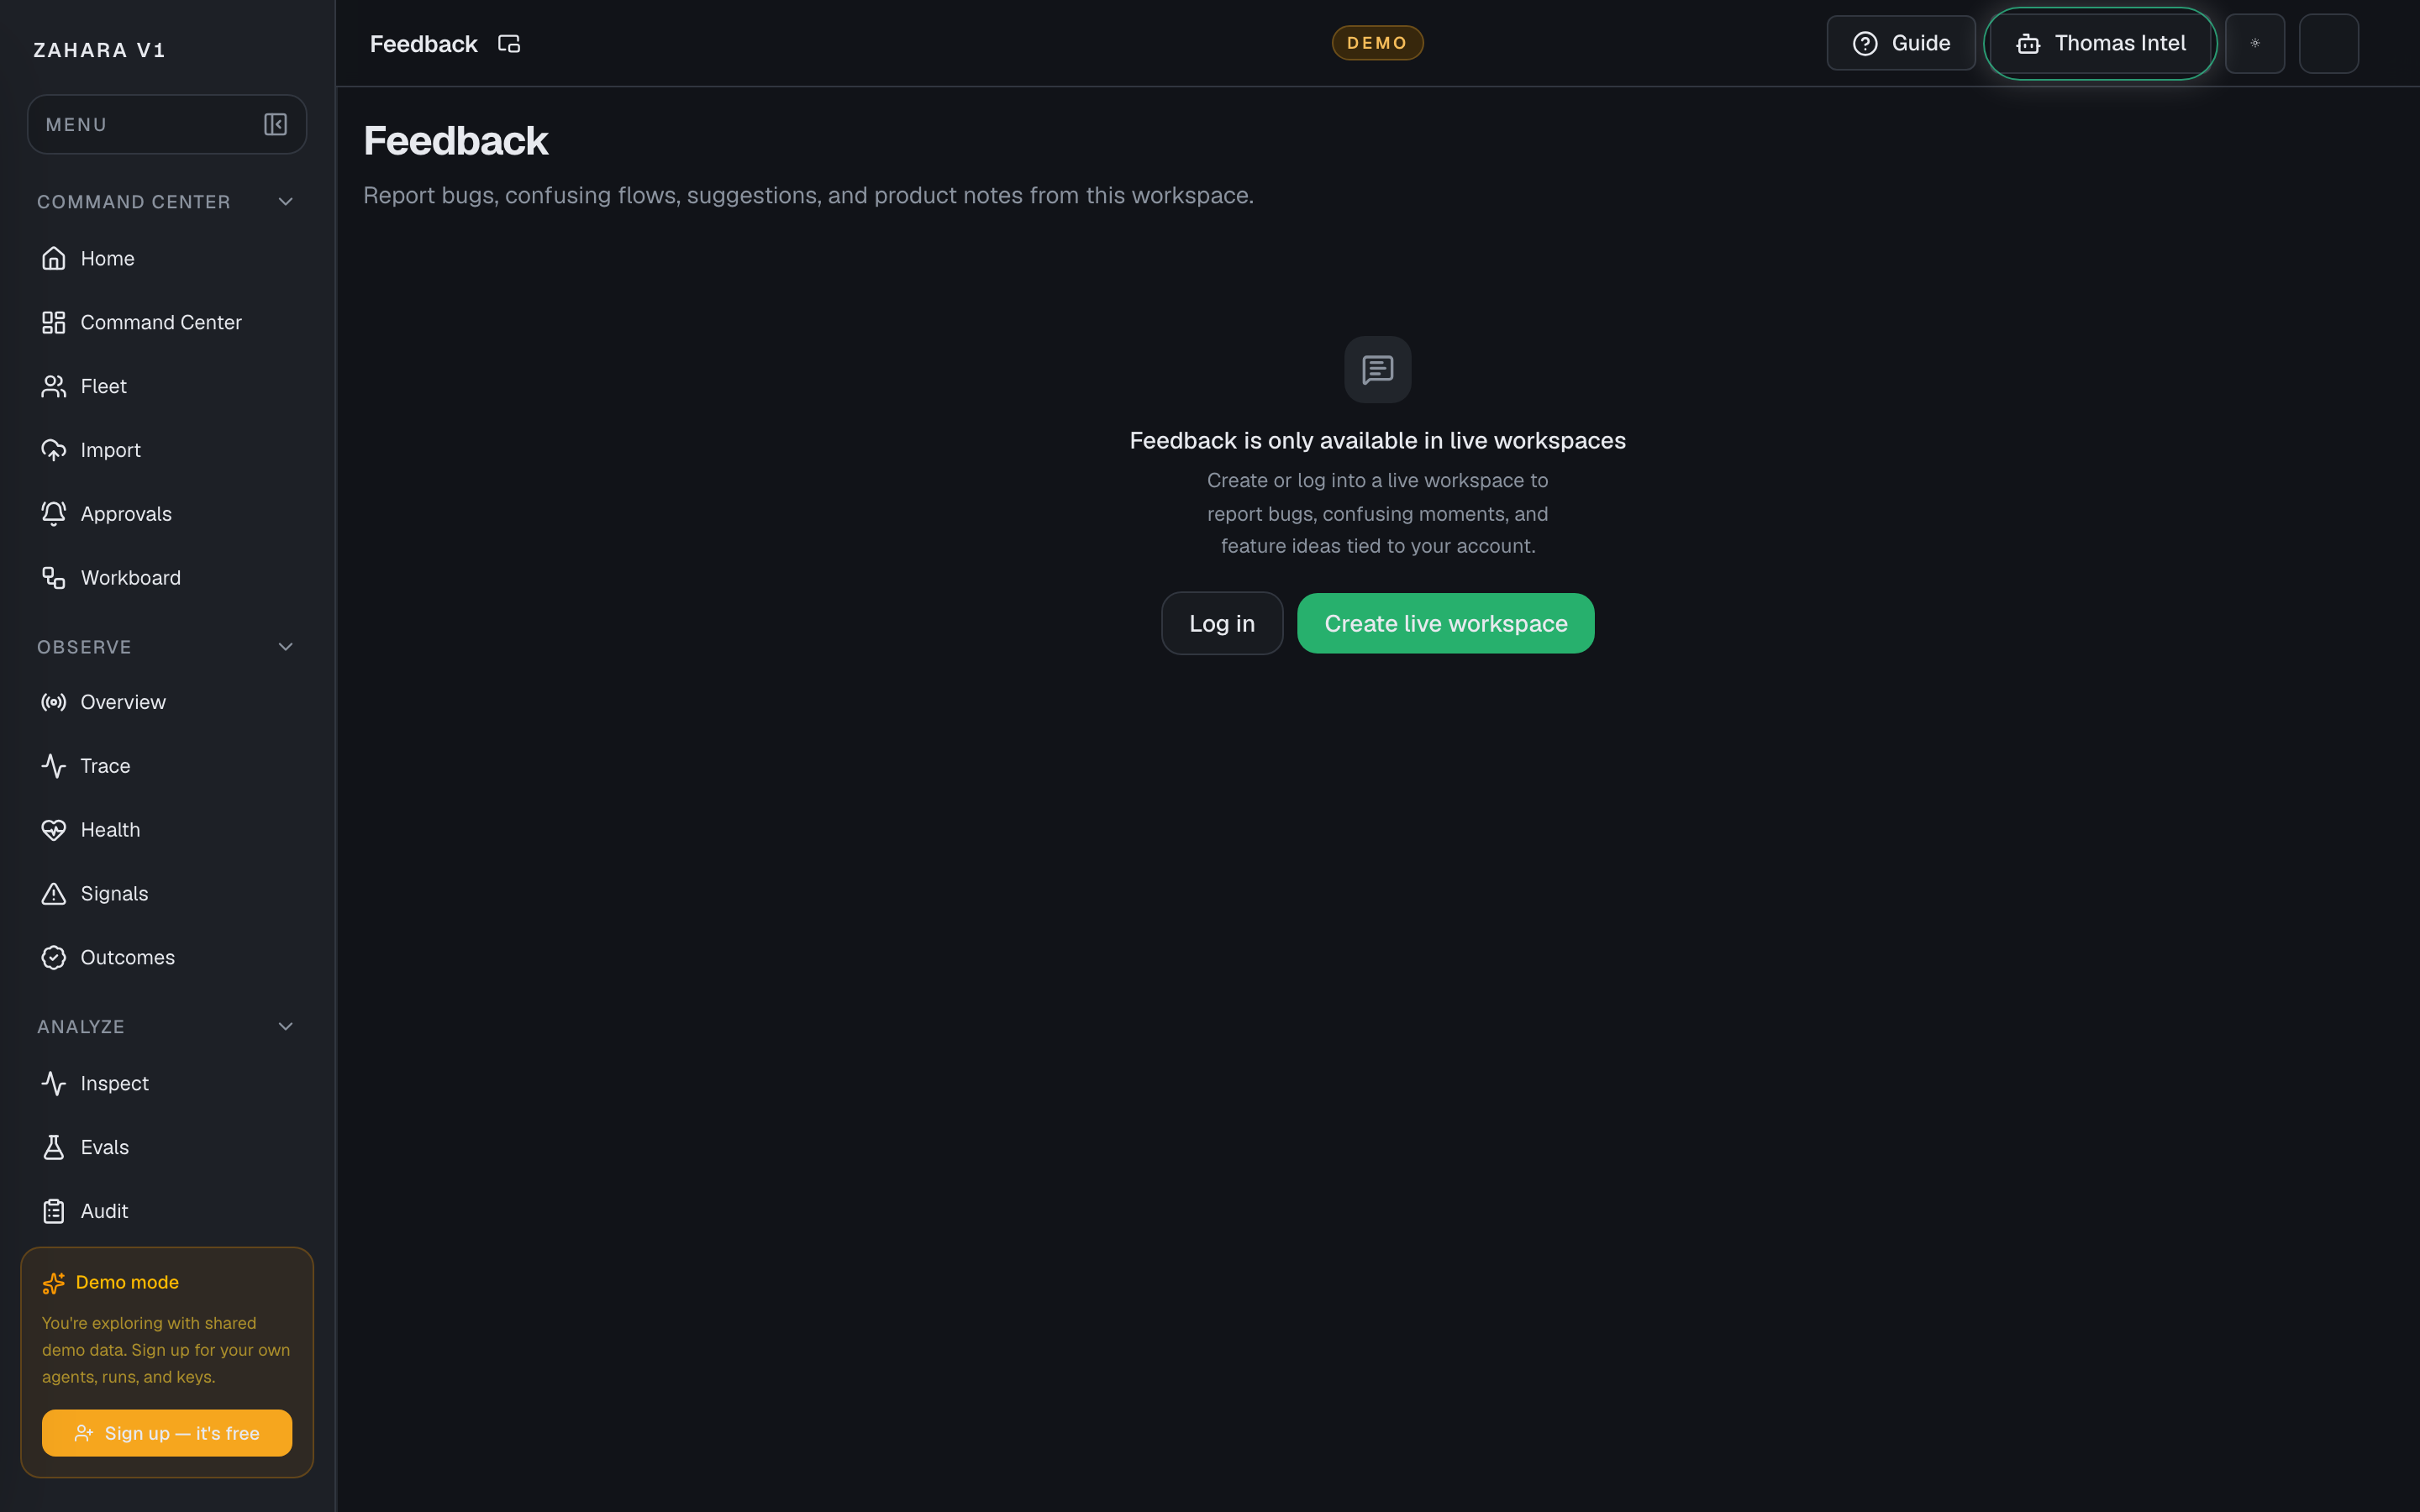
Options and features
| Option | What it does | Value it adds | How to use it |
|---|---|---|---|
| Feedback form | Captures the issue, suggestion, or confusion. | Turns beta friction into product signal. | Write what happened, what was expected, and where it happened. |
| Category or severity | Classifies the feedback. | Helps the team prioritize urgent beta blockers. | Use blocker only when the workflow cannot continue. |
| Submit | Sends the report to the Zahara team. | Keeps feedback out of private chat archaeology. | Submit while the page context is fresh. |
Basic workflow
- 1Open Feedback from the page where friction happened.
- 2Describe what happened and what was expected.
- 3Include route, agent, run, or onboarding ID if visible.
- 4Submit and continue with a workaround if possible.
Proof that it worked
- Feedback is submitted.
- Report includes enough context to reproduce or understand the issue.
Before you start
- Confirm you are on /feedback and looking at the right workspace.
- Read visible status, warning, or empty-state text before clicking an action.
- If the page shows IDs, copy the relevant agent, run, onboarding, or request ID before switching pages.
If you get blocked
- If the page is empty, check whether filters, scope, or time window are hiding the data.
- If an action is locked, follow the visible lock reason before trying another route.
- If Feedback does not answer the question, open the linked evidence page instead of guessing.
Useful Thomas questions
- Based on the visible state, what is the next safe action?
- Which status, warning, or ID should I verify first?
- Which linked evidence page proves this Feedback state?
Settings
What it is
Settings controls the workspace helper experience through the Thomas Intel surface.
Value to users
It helps teams decide how Thomas Intel should assist with navigation, explanation, and safe page actions.
Use it when
- Enable, disable, reset, or inspect Thomas Intel.
- Prepare a safer helper experience for beta users.
- Understand what Thomas Intel can do on a page.
Next safe action
Confirm Thomas Intel is enabled for the workspace, then ask page-specific questions grounded in visible page data.
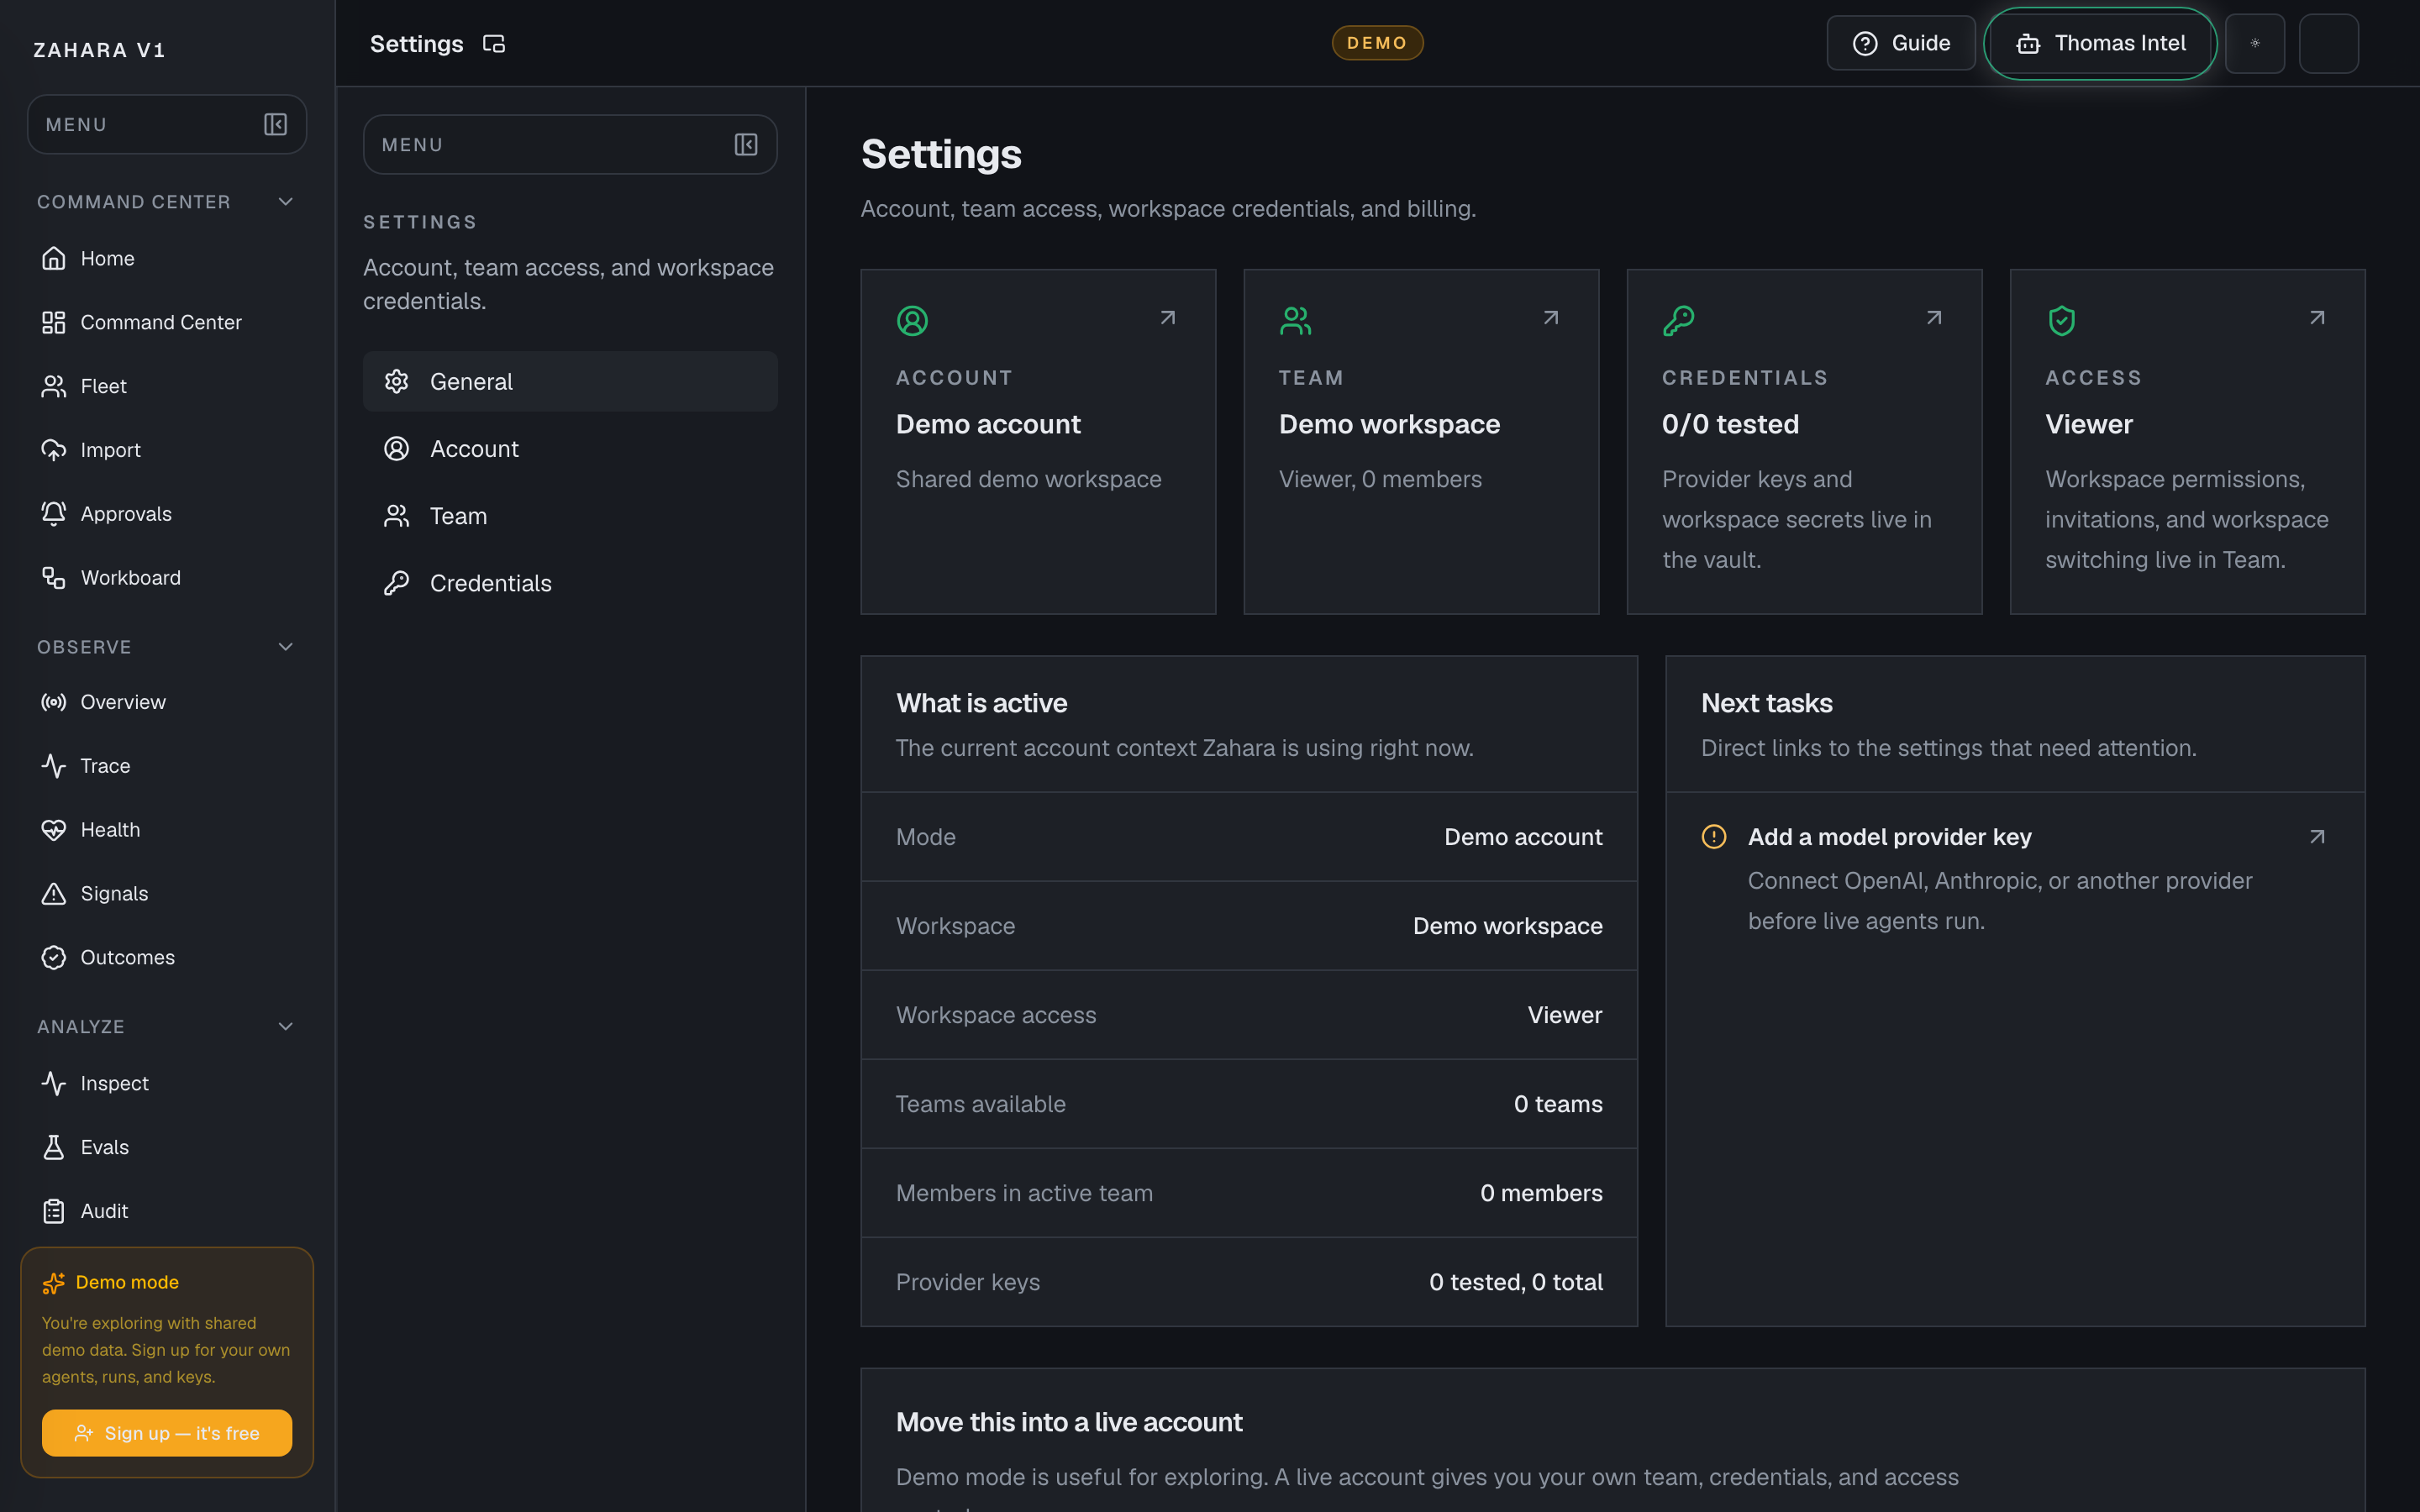
Options and features
| Option | What it does | Value it adds | How to use it |
|---|---|---|---|
| Thomas Intel status | Shows whether the helper is available. | Lets teams control whether in-app help is active. | Enable only when the workspace is ready for guided help. |
| Learning feed | Shows what Thomas Intel can use to improve page answers. | Turns page guides and visible data into better user support. | Keep training material operator-facing and safe. |
| Reset or mode controls | Adjusts Thomas Intel behavior. | Keeps helper behavior aligned with beta readiness. | Reset when answers drift or when page guide content changes. |
Basic workflow
- 1Confirm Thomas Intel is enabled.
- 2Ask a page-specific question.
- 3Check that Thomas Intel uses visible page data first.
- 4Update the operations manual if users keep asking the same question.
Proof that it worked
- Thomas Intel answers from visible page context.
- Thomas Intel does not invent counts, IDs, or private implementation details.
Before you start
- Confirm you are on /settings and looking at the right workspace.
- Read visible status, warning, or empty-state text before clicking an action.
- If the page shows IDs, copy the relevant agent, run, onboarding, or request ID before switching pages.
If you get blocked
- If the page is empty, check whether filters, scope, or time window are hiding the data.
- If an action is locked, follow the visible lock reason before trying another route.
- If Settings does not answer the question, open the linked evidence page instead of guessing.
Useful Thomas questions
- Based on the visible state, what is the next safe action?
- Which status, warning, or ID should I verify first?
- Which linked evidence page proves this Settings state?
Login
What it is
Login is the secure entry point for existing workspaces.
Value to users
It keeps private workspace data behind authenticated access.
Use it when
- A user already has an account.
- A private route redirects them to sign in.
- A beta user needs to return to their workspace.
- A new operator wants the dedicated onboarding path before opening Fleet or Command Center.
Next safe action
Sign in with the workspace account. If no next parameter is present, first-time users start in Onboarding; returning users with onboarding complete start in Command Center.
Options and features
| Option | What it does | Value it adds | How to use it |
|---|---|---|---|
| New user happy path | Shows the collapsible first-run path before sign-in. | Sets the expectation that Onboarding is the first door and Command Center is the daily default after setup. | Keep it open for first-time operators; collapse it when returning users already know the path. |
| Email and password | Authenticates a real workspace user. | Prevents anonymous guest access to private work. | Use the company/workspace account assigned during beta onboarding. |
| Next redirect | Returns the user to the page they originally requested. | Keeps sign-in from breaking the workflow. | After login, confirm the browser lands on the intended page. |
| Fleet shortcut | Sets next=/agents when the first job is reviewing or operating an existing agent. | Keeps Fleet available without making it the default first-run destination. | Use Open Fleet after sign-in only when the operator should skip directly to agent review. |
Basic workflow
- 1Open the login page.
- 2Read or collapse the new-user happy path.
- 3Enter workspace credentials.
- 4Confirm the redirect returns to the target page, Onboarding, or Command Center.
- 5From Onboarding, pick Build, Upload, or Connect before entering Command Center.
- 6From Command Center, check Team, Credentials, Agent, and Operate readiness before the first live run.
Proof that it worked
- User is authenticated.
- Private routes load without guest mode.
- The happy path explains Onboarding as the first-run starting point.
Before you start
- Confirm you are on /login and looking at the right workspace.
- Read visible status, warning, or empty-state text before clicking an action.
- If the page shows IDs, copy the relevant agent, run, onboarding, or request ID before switching pages.
If you get blocked
- If the page is empty, check whether filters, scope, or time window are hiding the data.
- If an action is locked, follow the visible lock reason before trying another route.
- If Login does not answer the question, open the linked evidence page instead of guessing.
Useful Thomas questions
- Based on the visible state, what is the next safe action?
- Which status, warning, or ID should I verify first?
- Which linked evidence page proves this Login state?
Register / Beta Signup
What it is
Register is the beta account intake path.
Value to users
It creates a real workspace request using company identity instead of anonymous demo access.
Use it when
- A new beta tester needs access.
- A sales team is onboarding a real company.
- A user has a company email and matching company website.
- A first-time operator needs the setup path before seeing the full app.
Next safe action
Enter name, company email, company name, company website, and password. New accounts start in Onboarding unless a next route or Fleet shortcut is used.
Options and features
| Option | What it does | Value it adds | How to use it |
|---|---|---|---|
| New user happy path | Shows the collapsible Onboarding to Team to Credentials to Agent to Operate setup path before signup. | Gives new users one safe route into the platform instead of dropping them into a blank or unfamiliar workspace. | Use it to explain the first session; collapse it when the user is already trained. |
| Full name | Identifies the human requesting access. | Makes follow-up and workspace setup personal. | Use the tester's real name. |
| Company email | Validates the request against a company domain. | Keeps beta access tied to real organizations. | Use the work email, not a free personal email. |
| Company name and website | Captures the organization context. | Helps sales and onboarding understand who is requesting access. | Use the real company name and public website. |
| Fleet shortcut | Sets next=/agents for teams whose first task is reviewing existing agents. | Preserves the agent-review path without making Fleet the default for every new user. | Use Open Fleet after signup only when the operator already knows they need Fleet first. |
Basic workflow
- 1Open Register.
- 2Read or collapse the new-user happy path.
- 3Enter real identity and company fields.
- 4Submit and land in Onboarding by default.
- 5Choose Build, Upload, or Connect from the onboarding page.
- 6Follow Team, Credentials, Agent, and Operate readiness before the first live run.
Proof that it worked
- Signup rejects free email domains.
- Signup records name, company email, company name, and website.
- Intake is routed for admin follow-up.
- The happy path explains the default Onboarding landing.
Before you start
- Confirm you are on /register and looking at the right workspace.
- Read visible status, warning, or empty-state text before clicking an action.
- If the page shows IDs, copy the relevant agent, run, onboarding, or request ID before switching pages.
If you get blocked
- If the page is empty, check whether filters, scope, or time window are hiding the data.
- If an action is locked, follow the visible lock reason before trying another route.
- If Register / Beta Signup does not answer the question, open the linked evidence page instead of guessing.
Useful Thomas questions
- Based on the visible state, what is the next safe action?
- Which status, warning, or ID should I verify first?
- Which linked evidence page proves this Register / Beta Signup state?